Billions of Sketches Reveal Hidden Cultural Variation in Human Concepts
Abstract: Claims about the universality of human concepts have been predominantly assessed through linguistic similarity across languages and cultures. However, words are effective as communication devices because they compress rich experiential variation into shared conventions, potentially obscuring hidden individual and cultural differences in how concepts are mentally represented. Here, we analyse 2.6 billion human-made sketches of common concepts from 236 countries and territories to examine conceptual structure through people's visual imagination. Consistent with recent work on image-based cognition, we find that single concepts unfold into multiple distinct visual exemplars, revealing latent information about similarities and differences in conceptual structure across cultures. This variation is strongest for concepts involving haptic interaction, suggesting that visual imagery reflects variation in embodied experience as much as conventional definitions. Comparing embedding models of sketches with word embedding models across languages, we find that their geometries diverge, with visual representations preserving rich semantic and cultural structure that LLMs compress. Cross-cultural similarities derived from sketches align 45% more closely with established cultural distances than do text-based measures. Together, these results suggest that patterns of human conceptual universality may depend critically on the modality through which concepts are measured, with large-scale sketching providing a direct, high-resolution probe of conceptual diversity across embodied and cultural dimensions of thought.

















Paper Prompts
Sign up for free to create and run prompts on this paper using GPT-5.
Top Community Prompts
Explain it Like I'm 14
Plain-language summary of “Billions of Sketches Reveal Hidden Cultural Variation in Human Concepts”
What this paper is about (big picture)
The paper asks a simple question: Do people around the world think about common things in the same way? Instead of only looking at words (like how different languages use the word “pizza”), the authors look at drawings people made of the same ideas. They study 2.6 billion quick sketches—like doodles—of everyday things (animals, foods, objects, actions) from 236 countries to see how concepts look in people’s minds across cultures.
The main questions, in simple terms
The researchers focus on four easy-to-grasp questions:
- When people draw the same thing (like “pizza”), do their drawings settle into one typical picture, or several common versions?
- Do certain kinds of things (like objects you can hold or use with your hands) get drawn more consistently than others?
- Do the patterns in pictures match the patterns in words? In other words, do image-based similarities and language-based similarities agree?
- Do drawings reflect real cultural differences between countries better than words do?
How they studied it (what they did and how it works)
They used data from a game called QuickDraw, where players have 20 seconds to draw a given concept (like “fish” or “phone”) while a computer tries to guess it.
To make sense of billions of doodles, they used a few simple ideas:
- Turning pictures into numbers: Think of each drawing getting a “fingerprint”—a long list of numbers that captures its overall shape and structure. This lets a computer compare drawings fairly.
- Making a map of drawings: They place these fingerprints on a 2D map so that similar drawings land near each other. Nearby drawings form “neighborhoods.”
- Finding groups (clusters): They look for tight neighborhoods of similar drawings. Each neighborhood is a common “way” people draw the same idea (for example, pizza as a whole pie vs. a slice).
- Measuring how clusterable a concept is: This is like asking, “Do drawings of this idea fall into clear, repeated styles, or are they all over the place?”
- Linking drawing patterns to our senses: They checked whether ideas that involve the body—especially the hands (touch, holding, using)—are drawn in more consistent ways.
- Comparing pictures and words: They built two kinds of similarity maps across countries:
- A picture-based map: Which countries draw concepts in similar ways?
- A word-based map: Which countries’ main languages use concept words in similar ways?
- Checking against real cultural data: They compared both maps to a well-known survey of global values and beliefs (the World Values Survey) to see which map matches real cultural distances better.
What they found and why it matters
Here are the key discoveries, with quick examples to make them concrete:
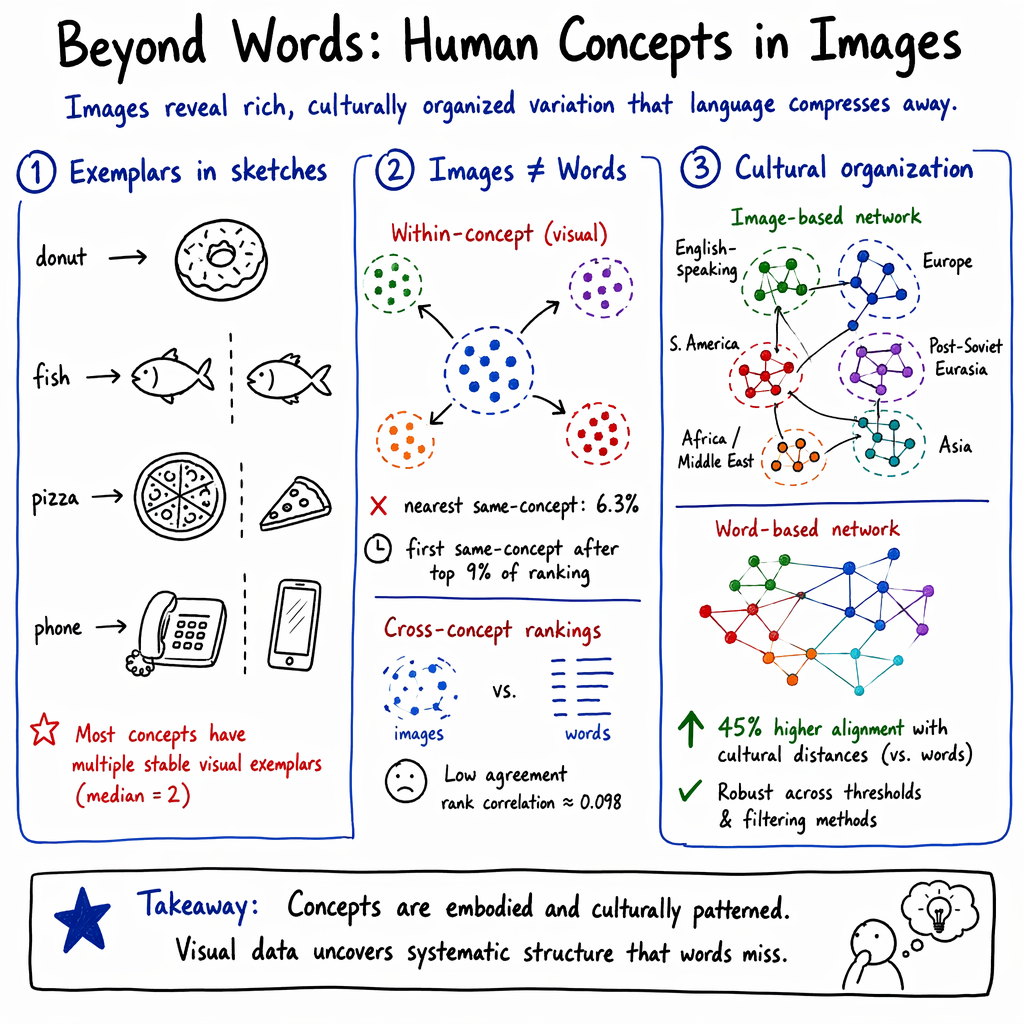
- Most concepts split into a few common drawing styles, not just one. The typical concept had a median of two main “looks.”
- Donut: usually one clear style (a ring with a hole).
- Fish: often split by direction (left-facing vs. right-facing).
- Pizza: slice vs. whole pie.
- Phone: old landline shapes and several smartphone shapes.
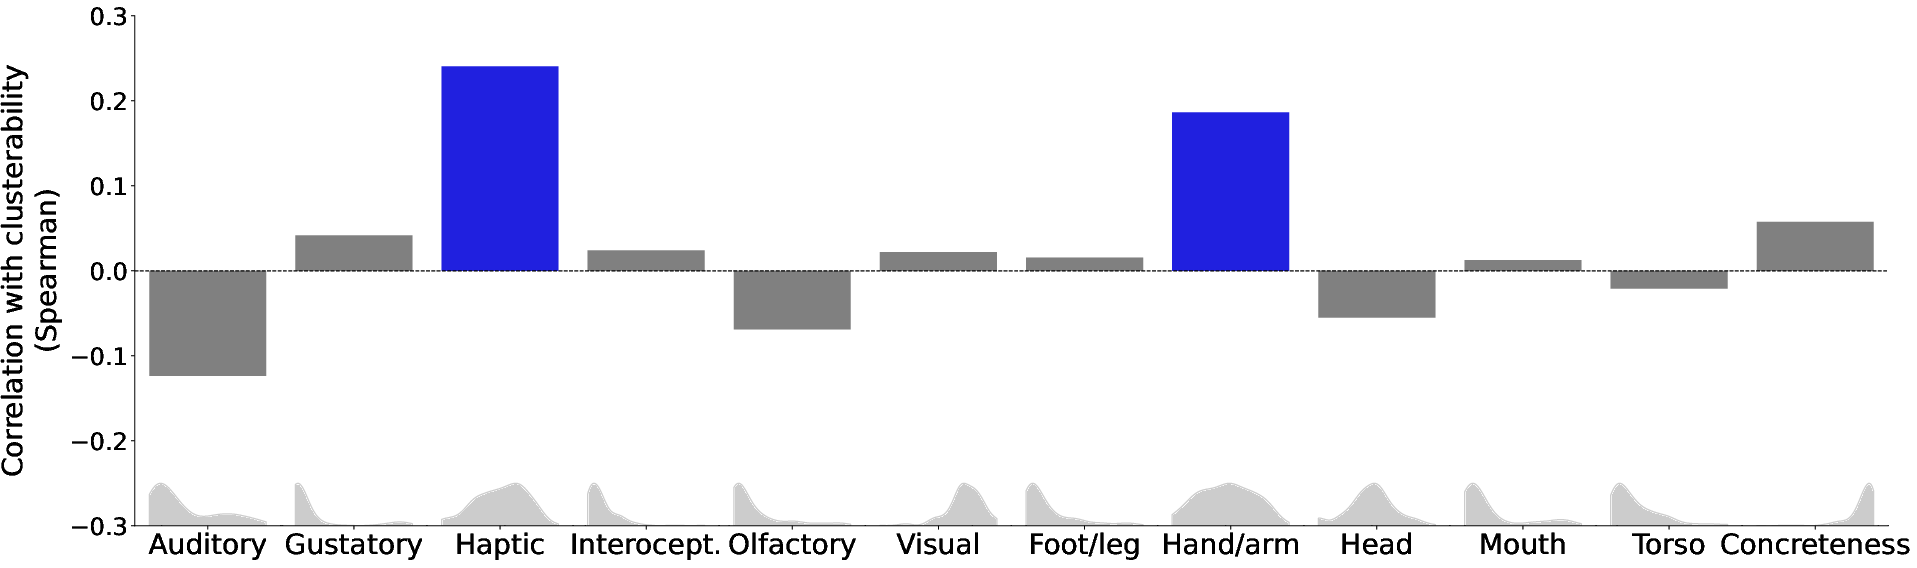
- Things you can touch or handle (haptic interaction) are drawn more consistently. Ideas tied to hands and arms form clearer clusters, suggesting our bodily experiences shape our mental pictures.
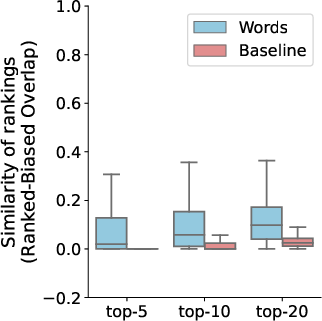
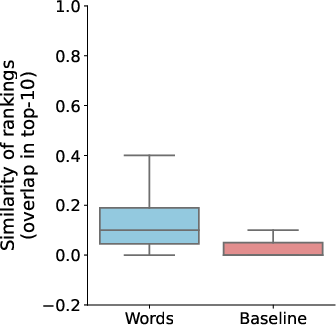
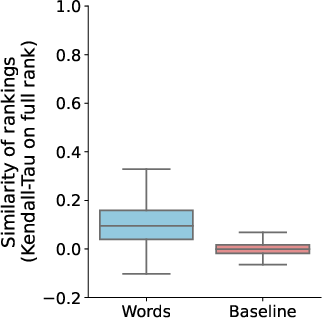
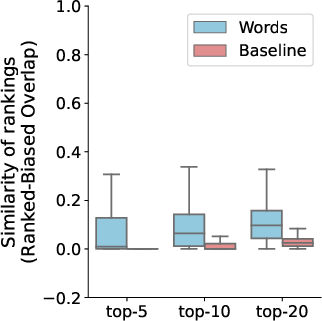
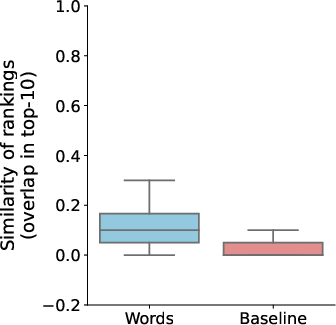
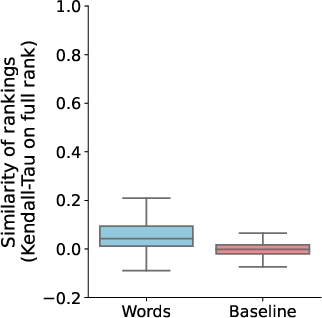
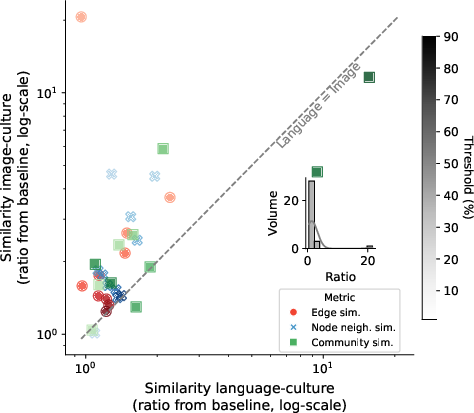
- Pictures and words organize ideas differently. The “map” of how concepts relate in drawings does not match the “map” made from words very well. On average, the agreement between image-based and word-based similarity rankings is very low (about 0.10 on a 0–1 scale), meaning pictures preserve details that words often compress or leave out.
- Example: A pizza slice drawing is most similar to “triangle” drawings before it’s similar to a whole pizza drawing—showing that visual shape can matter more than the word label.
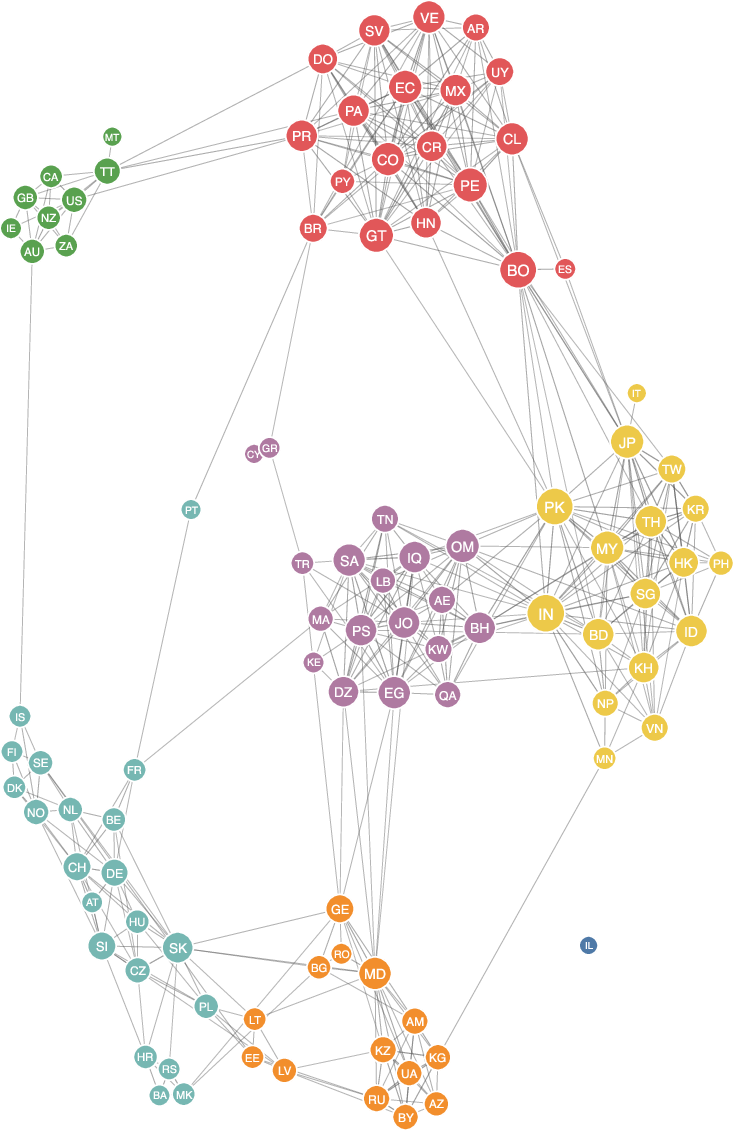
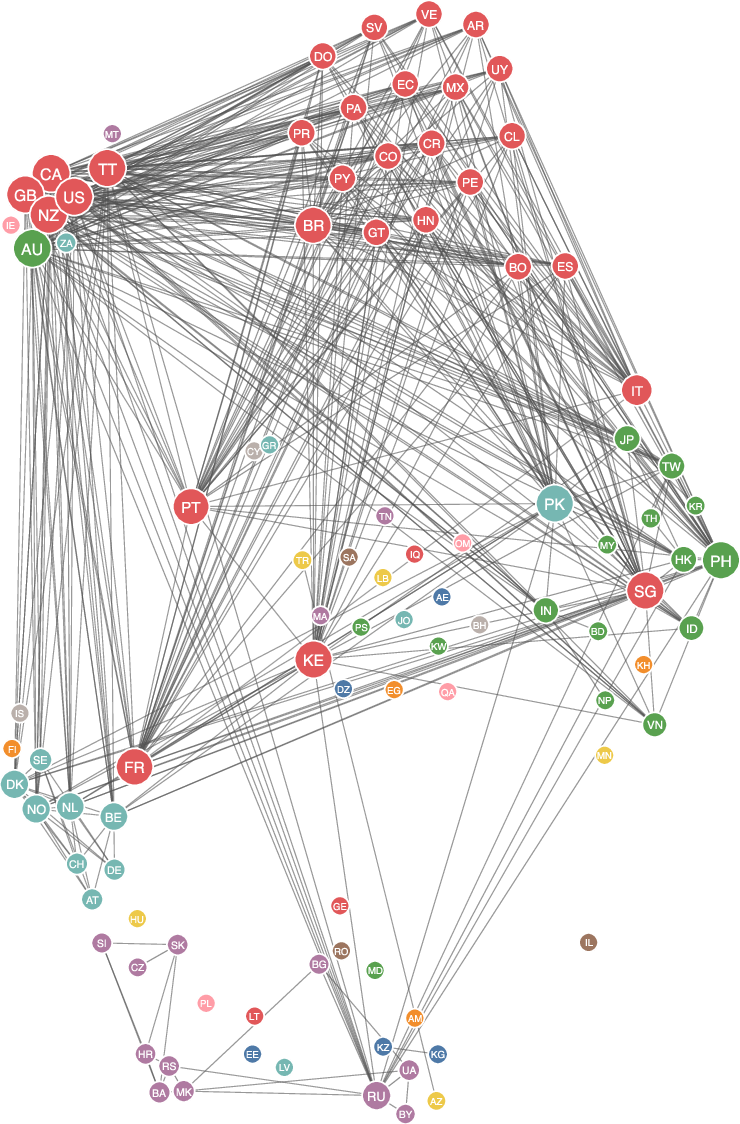
- Drawings match real cultural patterns better than words do. When the researchers compared country-by-country similarity networks to cultural data, the picture-based network lined up 45% more closely with known cultural distances than the word-based network. Regions like South America, Europe, and post-Soviet Eurasia appeared more clearly in the image network than in the word network.
Why this matters: It shows that looking only at language can hide rich differences in how people actually imagine and picture the world. Images capture extra layers of meaning tied to perception, the body, and culture.
What this could mean going forward (implications)
- For understanding the mind: Human concepts aren’t just about words. They’re multimodal—built from language plus imagery and body-based experience. To truly understand how people think, we need to study both.
- For cross-cultural research: Drawings provide a powerful lens for spotting cultural differences that words alone can blur. This can improve studies in psychology, anthropology, and communication.
- For artificial intelligence: AI trained only on text misses important parts of human concepts. Adding massive, human-made visuals (and other senses) can help AI learn more human-like, culturally aware representations.
- For education and design: Knowing that people picture the same idea in different ways can guide teaching, symbols, and interfaces that work better across cultures.
A note on limits: The data comes mostly from people with internet access and has more users from some countries (like the U.S.). Drawings were rushed (20 seconds), and tools varied. Still, the huge scale—billions of sketches—lets strong, repeated patterns stand out despite those issues.
In short, the study shows that our shared ideas aren’t just in our words—they live in our pictures, hands, and experiences. And when you look there, you see both surprising similarities and meaningful cultural differences that words alone can’t fully capture.
Knowledge Gaps
Below is a consolidated list of concrete knowledge gaps, limitations, and open questions that the paper leaves unresolved, framed to guide future research:
- Sampling imbalance and coverage: Predominance of anglophone/US participants and under-representation of many regions; need stratified, quota-based sampling that intentionally oversamples underrepresented countries and communities.
- Missing demographics: Absence of age, gender, education, SES, and urban–rural indicators prevents testing how conceptual variability scales with demographic factors; collect and analyze demographic covariates.
- IP-based geolocation uncertainty: Potential VPN use, travel, and diaspora effects; validate country assignment via self-reports or triangulation and assess sensitivity to geolocation errors.
- In-game feedback confound: Real-time classifier guesses may nudge drawings toward canonical forms; run controlled variants with feedback disabled to quantify its influence on prototypes and clusterability.
- Recognition filter bias: Retaining only sketches “recognized” by the model could preferentially exclude culturally distinctive or atypical exemplars; reanalyze including unrecognized sketches or with an unbiased inclusion protocol.
- Time-pressure effects: The 20-second limit likely favors simple, canonical depictions; experimentally manipulate time constraints to measure impacts on exemplar diversity and cultural distances.
- Device/interface heterogeneity: Mouse vs stylus vs touch, stroke smoothing, and screen size likely shape drawings; record device metadata and estimate device effects or standardize interfaces.
- Practice and individual style: Repeated play and drawing skill may drive idiosyncratic styles; model individual random effects and quantify variance attributable to personal style vs concept vs culture.
- Orientation/scale invariances: Clusters (e.g., left- vs right-oriented fish) may reflect orientation/handedness rather than conceptual distinctions; apply rotation/scale normalization and test cluster stability.
- Embedding model bias: DINOv2 (trained on internet photos) may encode culturally skewed visual priors; replicate with alternative backbones (e.g., CLIP variants, MAE, SAM, sketch-trained encoders) and sketch-only training.
- Clustering on 2D UMAP: UMAP can distort neighborhood relations; assess robustness using clustering in higher-dimensional spaces (e.g., HDBSCAN on PCA space) and compare to t-SNE/UMAP-free pipelines.
- Parameter and threshold sensitivity: Treating clusters <1% as noise may discard rare but meaningful cultural exemplars; explore multi-resolution clustering, rare-cluster detection, and hierarchical models.
- Human validation of exemplars: Do discovered clusters align with human-perceived exemplar categories; collect human judgments on cluster coherence and exemplar labels across cultures.
- Temporal dynamics: Concepts like “phone” changed rapidly (2016–2019); analyze exemplar shifts over time and link to product diffusion, policy changes, or media trends.
- Environmental linkage: Test whether country-level affordances (object availability, signage standards, cuisine prevalence, climate) predict exemplar usage across concepts.
- Haptic correlation strength: The haptic–clusterability link appears selective and modest; preregister replications with direct sensorimotor manipulations (training/priming) to test causality.
- LLM-imputed psycholinguistic scores: Validate LLaMA-generated concreteness/sensorimotor ratings against new human annotations; quantify sensitivity of findings to imputed items and potential model bias.
- Concept set scope: QuickDraw categories are mostly concrete, imageable nouns; extend to actions, relations, and abstract concepts to test generalization of visual exemplar structure.
- Prompt language and localization: Unclear whether prompts were localized; if English-only, misinterpretations could drive variation; document localization and compare behavior across language interfaces.
- Multilingual reality within countries: Using a single “primary language” per country ignores multilingual populations; weight language embeddings by country-specific language-use distributions and dialectal variation.
- Translation/polysemy issues: Single-word translations can be ambiguous; employ sense-disambiguated, context-aware embeddings and multiword expressions grounded in country-specific corpora.
- Language embedding baselines: Evaluate stronger multilingual baselines (e.g., LaBSE, mUSE, XLM-R, M-CLIP, language-model contextual embeddings) and corpus-derived concept vectors to probe word–image divergence.
- Cultural benchmark breadth: WVS CF index is one operationalization; test alignment against alternative cultural distances (Inglehart–Welzel, Hofstede, geography, migration, trade, colonial/linguistic ties) and composite models.
- Network construction choices: Image-based country similarity relies on log-odds, z-scoring, Euclidean distances, and ad hoc zeroing thresholds (0.9–1.1); benchmark against cosine, Jensen–Shannon, EMD, and Bayesian shrinkage for small cells.
- Community detection robustness: Louvain can be unstable; compare to Leiden, multilayer methods, and stochastic block models; quantify partition stability and statistical significance.
- Edge filtering dependence: Results reported after top x% thresholding/disparity filtering; provide weighted (unthresholded) network comparisons and systematic α selection with uncertainty quantification.
- Statistical uncertainty: Report confidence intervals/bootstraps for rank correlations, network similarities, and cluster counts; perform out-of-sample and cross-country resampling to assess stability.
- Concept frequency balancing: Cap of 10,000 per country–category may not fully equalize exposure; evaluate alternative balancing/weighting to remove residual sample-size confounds.
- Visual–verbal divergence baselines: The reported rank correlation (~0.098) needs benchmark baselines and error bars; test whether divergence persists after controlling for iconicity/imageability and for concept category.
- Writing direction and handedness: Examine whether left/right orientation clusters correlate with reading direction and handedness prevalence across countries.
- Bot/adversarial activity: Identify and control for automated or noncompliant inputs (e.g., writing the word); quantify their impact on clustering and country similarities.
- Individual-level causal mechanisms: Design within-subject experiments to test how sensorimotor experiences, cultural primes, and environmental exposure causally shift a person’s exemplar usage.
- Cross-modality generalization: Replicate with photographs, gestures, 3D object manipulations, or eye-movement traces to assess whether visual exemplar structure extends beyond sketches.
- Multimodal fusion: Develop and evaluate methods to integrate word and image embeddings to better predict cultural distances and human similarity judgments.
- Reproducibility and access: Full dataset is under NDA; create and release a demographically annotated, globally balanced open dataset and replication-ready pipelines.
Practical Applications
Overview
This paper analyzes 2.6 billion QuickDraw sketches across 344 concepts from 236 countries to reveal that human concepts typically unfold into multiple visual exemplars (median of two per concept), that image-based conceptual geometry diverges markedly from word-based semantics, and that image-based similarities align 45% more closely with established cultural distances than text-based measures. The authors introduce a scalable workflow for embedding and clustering sketches (DINOv2 → PCA → UMAP → DBSCAN + grid-based fallback), quantify “clusterability,” link it to embodied (especially haptic) properties, and build country similarity networks to compare image-, word-, and culture-based structures.
Below are practical applications derived from the findings and methods, grouped by immediacy and linked to sectors. Each item includes potential tools/products/workflows and key assumptions/dependencies.
Immediate Applications
The following applications can be piloted or deployed with existing datasets, models, and workflows (leveraging the public 50M QuickDraw sample, DINOv2, multilingual embeddings, standard clustering, and network analysis).
- Cross-cultural icon and pictogram localization (software, UX, marketing, public signage)
- What: Localize icons, emojis, and infographic symbols to match region-specific visual exemplars (e.g., “phone” as smartphone vs. landline, “pizza” as slice vs. whole).
- Tools/workflows: “Cultural Icon Recommender” plugin for Figma/Sketch; pipeline to compute per-market cluster prevalence; A/B testing dashboards integrated with analytics.
- Assumptions/dependencies: QuickDraw demographic bias (41% US) may skew prevalence; requires validation with local users; legal/brand compliance.
- Region-aware UI/UX testing and optimization (software, e-commerce, mobile)
- What: Use sketch-derived exemplar clusters to pre-screen icons for comprehension across locales and adapt onboarding/tutorial visuals.
- Tools/workflows: Icon comprehension pretest suite; “exemplar-dissimilarity” alert that flags icons likely to be misinterpreted in specific markets.
- Assumptions/dependencies: Device- and input-modality differences (mouse vs. touch) can affect perception; ongoing monitoring for cultural drift.
- Marketing creative localization and A/B testing (marketing, advertising)
- What: Optimize ad creatives and packaging by aligning imagery to local visual exemplars for common concepts (food, objects, activities).
- Tools/workflows: “Sketch-based Market Insights” service that maps target concepts to region-specific visual variants; automated creative variant generation and test plans.
- Assumptions/dependencies: Cultural representativeness varies across concepts; need privacy-safe aggregation and consent for any new data collection.
- International safety and health pictograms tuning (policy, public health, transportation)
- What: Adjust existing ISO-style pictograms (e.g., evacuation, hygiene, medication) to match locally dominant visual forms for improved comprehension.
- Tools/workflows: Rapid usability testing panels per region; exemplar-informed pictogram templates; policy compliance checklists.
- Assumptions/dependencies: Must comply with standards (ISO, ANSI); regulatory approval cycles; equivalence testing required to avoid confusion.
- Low-literacy and multilingual communication aids (healthcare, education, NGOs)
- What: Use culturally resonant visuals for patient instructions, medication adherence, and community education.
- Tools/workflows: “Visual Literacy Kit” that selects icons by cluster prevalence for a target region; printable and mobile-friendly assets.
- Assumptions/dependencies: Clinical and ethical review; local co-design to prevent misinterpretation.
- Product search and recommendation via visual conceptual neighborhoods (software, e-commerce)
- What: Improve search ranking and recommendations by blending visual exemplar similarity with text semantics, reducing reliance on language-only embeddings.
- Tools/workflows: Multimodal retrieval (text + sketch/image embeddings) with exemplar-aware reranking; MRL pipelines built on DINOv2 or CLIP-like encoders.
- Assumptions/dependencies: Need curated negative sampling to avoid overfitting visual lookalikes; compute costs manageable at scale.
- Sketch-based ideation support in creative tools (design, education)
- What: Suggest multiple culturally common visual exemplars while drawing (e.g., “moon” crescent vs. full), aiding brainstorming and learning.
- Tools/workflows: On-canvas “Exemplar Variants Palette” leveraging cluster centroids; integrate with vectorization and refinement tools.
- Assumptions/dependencies: Responsible use to avoid reinforcing stereotypes; add user controls for region selection.
- Cognitive research and classroom demonstrations (academia, education)
- What: Use the pipeline to teach embodied cognition, multimodality, and cross-cultural variation in concepts.
- Tools/workflows: Open notebooks replicating PCA/UMAP/DBSCAN on the public sample; classroom datasets and assignments.
- Assumptions/dependencies: Use public subset due to NDA on full corpus; emphasize sampling biases in instruction.
- Cultural analytics for localization planning (media, gaming, streaming)
- What: Choose visual styles (e.g., props in game scenes, UI elements) based on country-level similarity networks rather than language-only metrics.
- Tools/workflows: “Multimodal Cultural Alignment Score” combining image-based network proximity with market data; dashboards for PMs and producers.
- Assumptions/dependencies: Country ≠ culture in all cases; supplement with qualitative research.
- Accessibility improvements for neurodiverse and aging users (healthcare, software)
- What: Prefer exemplars with higher clusterability (especially haptic-related) to improve recognizability and reduce cognitive load.
- Tools/workflows: “Clusterability Index” baked into design systems to score icon choices; accessibility review checklists.
- Assumptions/dependencies: Needs user testing with target populations; integrate with WCAG guidance.
Long-Term Applications
These applications require further research, scaling, productization, or standards development, and would benefit from new data collection, multimodal model training, or longitudinal tracking.
- Multimodally grounded foundation models with cultural alignment (AI/ML)
- What: Train LLMs/VLMs that integrate sketch-based concept geometry to better approximate human conceptual diversity and reduce language-only compression.
- Tools/workflows: Contrastive training (text ↔ sketch exemplars), culture-aware evaluation sets; “exemplar separation” regularizers.
- Assumptions/dependencies: Licensing/ethics for large-scale sketch data; guardrails to avoid amplifying biases; significant compute and curation.
- Embodied affordance learning for robots (robotics)
- What: Use haptic-related concepts (with higher clusterability) to bootstrap affordance categories and manipulation policies.
- Tools/workflows: Map visual exemplars to grasp primitives and action schemas; simulation-to-real pipelines linking sketch-derived forms to object meshes.
- Assumptions/dependencies: Requires high-fidelity linking from 2D exemplars to 3D affordances; extensive robot data for grounding.
- Dynamic, data-driven standards for international pictograms (policy, standards bodies)
- What: Inform ISO/IEC and WHO icon standards with empirically derived exemplar distributions that can update over time.
- Tools/workflows: Periodic global sketch surveys; cultural network monitoring; standard revision workflows.
- Assumptions/dependencies: Consensus processes are slow; need strong evidence of improved comprehension and safety outcomes.
- Cultural drift and cohesion monitoring via image-based indices (policy, social science)
- What: Use longitudinal sketch-based networks as early indicators of cultural change, convergence/divergence, or assimilation patterns.
- Tools/workflows: Repeatable survey panels; privacy-preserving telemetry via opt-in drawing apps; statistical change detection.
- Assumptions/dependencies: Ethical oversight; avoid surveillance misuse; ensure representative sampling beyond anglophone internet users.
- Personalized and adaptive iconography in operating systems and apps (software, platforms)
- What: OS- or app-level icon sets that adapt to a user’s cultural background or inferred preferences without altering functionality.
- Tools/workflows: On-device “exemplar profile” learning; safe fallback to globally common forms; opt-in personalization controls.
- Assumptions/dependencies: Privacy constraints; risk of fragmentation and user confusion if switching across apps.
- Health communication personalization and outcomes optimization (healthcare)
- What: Tailor patient instructions, consent forms, and safety signage to visual exemplars that maximize comprehension and adherence by demographic/cultural segment.
- Tools/workflows: Outcome-driven icon selection algorithms; randomized pragmatic trials measuring adherence, misinterpretation, and safety incidents.
- Assumptions/dependencies: Requires clinical trials and IRB approvals; equitable access to localized materials.
- Education technology that teaches across conceptual exemplars (education, EdTech)
- What: AI tutors and curricula that present multiple culturally relevant exemplars for each concept to enhance transfer and reduce biases.
- Tools/workflows: Exemplar sequencing algorithms; alignment with local curricula; teacher dashboards for monitoring conceptual understanding.
- Assumptions/dependencies: Curriculum approvals; rigorous learning efficacy studies.
- Multimodal semantic search and knowledge graphs (software, enterprise)
- What: Build knowledge graphs that store both word-based and image-based links, supporting cross-modal reasoning and retrieval (e.g., “triangle-like pizza slice”).
- Tools/workflows: Dual-embedding stores; exemplar-aware entity linking; multimodal RAG pipelines.
- Assumptions/dependencies: Storage and indexing of high-dimensional embeddings at scale; governance for content provenance.
- Cross-cultural creative tools and co-creation platforms (media, design)
- What: Tools that surface how different cultures visualize the same concept to inspire inclusive creative work and co-create culturally resonant assets.
- Tools/workflows: “Exemplar Atlas” integrated into creative suites; collaborative boards that compare regional variants and provide usage guidance.
- Assumptions/dependencies: Community guidelines to prevent stereotyping; licensing of contributed assets.
- Neurocognitive assessment via sketch tasks (healthcare, research)
- What: Develop adaptive, culture-fair cognitive tests that use multiple exemplar prompts and measure deviations from expected cluster patterns.
- Tools/workflows: Tablet-based assessments; normative databases per region; automated scoring via embedding distance from cluster centroids.
- Assumptions/dependencies: Regulatory pathways for diagnostics; extensive validation across age, education, and culture.
- Security and human-in-the-loop verification (security, online services)
- What: Design CAPTCHAs or verification tasks that rely on culturally robust exemplars to increase accessibility and reduce failure rates.
- Tools/workflows: Exemplar-robust challenge generation; fairness-aware evaluation by region and language.
- Assumptions/dependencies: Adversarial robustness; accessibility trade-offs; ongoing adaptation to bot capabilities.
- New benchmarks for cultural alignment in AI (AI/ML, academia)
- What: Establish public benchmarks that evaluate whether models capture culturally meaningful visual concept geometry (beyond text-only universality).
- Tools/workflows: Curated, consented sketch datasets; standardized evaluation metrics (e.g., image–culture network similarity); leaderboards.
- Assumptions/dependencies: Ethical data sourcing; community adoption; continuous maintenance.
Key cross-cutting assumptions and dependencies
- Data representativeness: QuickDraw data skews anglophone/US and 2016–2019; additional, more representative and current data collections are advisable for high-stakes uses.
- Modality biases: Word-based and image-based measures capture different structures; combined multimodal evaluation is recommended.
- Ethics and privacy: Any new data collection must be opt-in, consented, and privacy-preserving; guardrails to avoid stereotyping and cultural essentialism.
- Validation: Human-in-the-loop testing across locales is necessary before deploying in safety-critical or regulated contexts.
- Technical stack: Access to robust image encoders (e.g., DINOv2/CLIP), scalable clustering and indexing, and multilingual embeddings; compute and MLOps capacity needed for productionization.
Glossary
- Action effectors: Body parts that carry out actions used to experience or interact with concepts. "their linkage to specific action effectors, including the mouth/throat, hand/arm, foot/leg, head (excluding mouth/throat), and torso."
- BERT-based: Refers to models built on the Bidirectional Encoder Representations from Transformers architecture. "multilingual word embeddings (built from the same BERT-based considered previously)"
- Bonferroni correction: A statistical adjustment to control the family-wise error rate when making multiple comparisons. "Blue bars correspond to significant values (, after Bonferroni correction), grey to non-significant ones."
- Centroid: The mean vector representing the center of a set of embeddings in feature space. "compute the centroid of image embeddings for each concept cluster."
- Community detection: Algorithms that find groups of nodes with dense intra-connections in a network. "We then apply community detection using the Louvain algorithm"
- Configuration model: A random graph model that preserves the degree sequence of an observed network. "we define a configuration model~\cite{newman2001random} that preserves the degree sequence of the culture-based network."
- Concreteness ratings: Numeric judgments of how tangible or perceptible a word’s meaning is. "concreteness ratings for about 40,000 English lemmas"
- Cosine similarity: A measure of similarity between vectors based on the cosine of the angle between them. "using cosine similarity between embeddings (image- or word-based)."
- Cultural Fixation (CFs) index: A measure of cultural distances between countries derived from the World Values Survey. "we use the Cultural Fixation (CFs) index developed by~\citet{muthukrishna2020beyond}"
- DBSCAN (Density-Based Spatial Clustering of Applications with Noise): A clustering algorithm that groups points based on density and labels sparse points as noise. "we apply Density-Based Spatial Clustering of Applications with Noise (DBSCAN)"
- DBCV (Density-Based Cluster Validity): A validation index for density-based clustering that evaluates cluster quality. "we employ Density-Based Cluster Validity (DBCV) optimization"
- DINOv2: A self-supervised vision model used to generate image embeddings. "the DINOv2 image embedding model, a self-supervised vision transformer"
- Disparity filtering: A technique to extract a statistically significant backbone of a weighted network. "Disparity filtering. Based on the definition by~\citet{serrano2009extracting}, we evaluate the weight of each edge relative to a null model and assign it a significance score ."
- Embodied cognition: The view that conceptual knowledge is grounded in sensorimotor systems and bodily experience. "research on embodied cognition shows that human concepts consist both of word-based and image-based sensory information"
- Euclidean distance: The straight-line distance between two points in a metric space, used here on standardized features. "we compute similarity using the Euclidean distance between their standardized (z-scored) log-odds ratios."
- Giant Connected Component (GCC): The largest connected subgraph in a network. "we evaluate the proportion of the original Giant Connected Component (GCC) retained at different thresholds"
- Interoception: The perception of internal bodily states, considered as a perceptual modality. "assessing their association with perceptual modalities—touch, hearing, smell, taste, vision, and interoception"
- Jaccard index: A set similarity measure defined as the size of the intersection divided by the size of the union. "Edge similarity: the Jaccard index of edge sets"
- Kendall Tau correlation: A rank correlation coefficient measuring ordinal association between two ranked lists. "Kendall Tau correlation scores on the overall rankings."
- Latent visual space: A learned feature space where visual similarity between sketches can be compared. "Sketches are compared in a latent visual space that captures structural properties of the drawings"
- Louvain algorithm: A community detection algorithm that optimizes modularity in networks. "as identified by the Louvain algorithm."
- Macro average rank correlation: An average of rank correlations computed across multiple items or categories. "with a macro average rank correlation of $0.098$ (on a scale from 0 to 1) across multiple correlation metrics and embedding models"
- Multilingual General Text Embedding model: A model that produces language-agnostic text embeddings across multiple languages. "a multilingual General Text Embedding model"
- Normalized Mutual Information (NMI): A metric to compare the agreement between two clusterings, normalized to [0,1]. "using the Normalized Mutual Information (NMI) score."
- Null model: A baseline random model used to assess the significance of observed patterns. "we evaluate the weight of each edge relative to a null model and assign it a significance score ."
- Odds ratio: A measure of association that compares the odds of an event across groups. "we compute the odds ratio"
- Principal Component Analysis (PCA): A linear dimensionality reduction technique that projects data onto directions of maximal variance. "Principal Component Analysis (PCA)"
- Rank-Biased Overlap (RBO): A top-weighted similarity measure for comparing ranked lists. "We then measure the Rank-Biased Overlap (RBO) between the top-5, top-10, and top-20"
- Self-supervised learning: Learning representations from unlabeled data via pretext tasks or objectives. "a self-supervised vision transformer"
- Sensorimotor experience: Experience derived from sensory inputs and motor actions that contributes to conceptual knowledge. "sensorimotor experience plays a fundamental role in cognition."
- Spearman's ρ: A nonparametric rank correlation coefficient assessing monotonic relationships. "Spearman's , "
- Uniform Manifold Approximation and Projection (UMAP): A nonlinear dimensionality reduction technique that preserves manifold structure. "Uniform Manifold Approximation and Projection (UMAP)"
- Vision transformer: A transformer-based neural network architecture applied to image data. "a self-supervised vision transformer"
- Word2Vec: A predictive embedding method that learns vector representations of words from context. "a Word2Vec model pre-trained on Google News"
- z-scored: Standardized by subtracting the mean and dividing by the standard deviation. "their standardized (z-scored) log-odds ratios."
Collections
Sign up for free to add this paper to one or more collections.

