- The paper introduces a three-stage, cognition-inspired pipeline that leverages VLM agents to generate editable scientific illustrations.
- It converts textual input into executable PowerPoint scripts, ensuring precise, publication-grade figures with minimal manual edits.
- Evaluation reveals 80% publication-readiness within 17 edits, outperforming existing raster-based and code-driven methods.
Motivation and Problem Definition
Scientific illustrations are fundamental for conveying conceptual frameworks, experimental workflows, and algorithmic designs in research publications. The construction of these figures is traditionally a labor-intensive process, often requiring deep domain expertise and proficiency in specialized design tools. Existing generative image models, while advancing prompt-based editing, fundamentally produce static raster images, making localized corrections of elements or text infeasible—especially when publication venues mandate vector-based, natively editable formats. Natural language instructions are insufficient for precise, element-level modification, as shown in the typical failure modes of prompt-based figure generation.
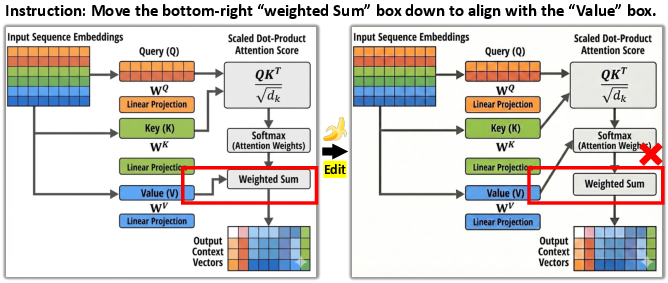
Figure 1: Natural language instructions struggle to guide generative models to make precise modifications to scientific figures.
Framework and Methodology
LiveFigure introduces an agentic pipeline inspired by the cognitive workflow of human figure designers. The design is divided into three stages: Visual Planning via Prior Induction, Procedural Figure Generation via Skills and Experience, and Targeted Refinement via Visual Diagnostics.
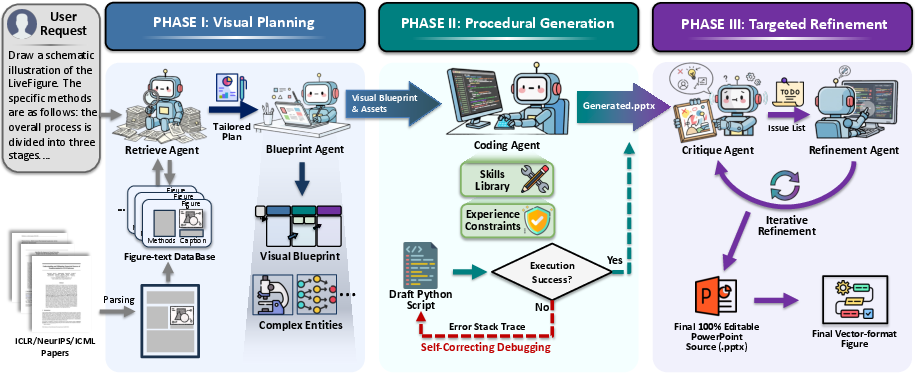
Figure 2: The LiveFigure pipeline simulates human design practices through visual prior induction, procedural code-driven figure generation, and targeted refinement.
Stage I: Visual Planning via Prior Induction
Visual prior induction is achieved by retrieving semantically-relevant reference figures from a rigorously curated figure-text knowledge base, using high-quality methodological schematics extracted from top-tier conferences. VLMs analyze both retrieved references and input textual context (caption, method description) to distill reusable design principles and infer layout blueprints. Complex domain-specific entities are synthesized into asset libraries via grid-based batch generation and automated style alignment.
The blueprint and asset library are mapped into executable scripts that generate editable figures within the PowerPoint environment. Standardized skills encapsulate high-level drawing primitives—such as container grouping, connector routing, and adaptive text placement—ensuring code executability and semantic consistency. Experience-driven negative constraints, distilled from large-scale debugging, guide code synthesis and mitigate API hallucinations. A self-correcting execution loop captures runtime errors and iteratively refines code until successful execution.
Stage III: Targeted Refinement via Visual Diagnostics
Post-generation, VLMs act as visual critics, identifying subtle visual flaws (e.g., occlusion, misalignment, styling inconsistencies) in rendered outputs. Incremental code updates address these actionable issues, optimizing for publication-grade clarity and fidelity. This closed-loop observe-diagnose-refine cycle continues until all identified issues are resolved.
Quantitative Evaluation
The main metric, Edit Distance, quantifies the atomic modification steps needed for human adoption of a generated figure. LiveFigure achieves 80% publication-readiness within 17 edits, compared to only 24% for Nano Banana, the strongest baseline. The cumulative adoption probability curve demonstrates concentrated minimal edit distances for LiveFigure, validating the efficiency of its staged pipeline.
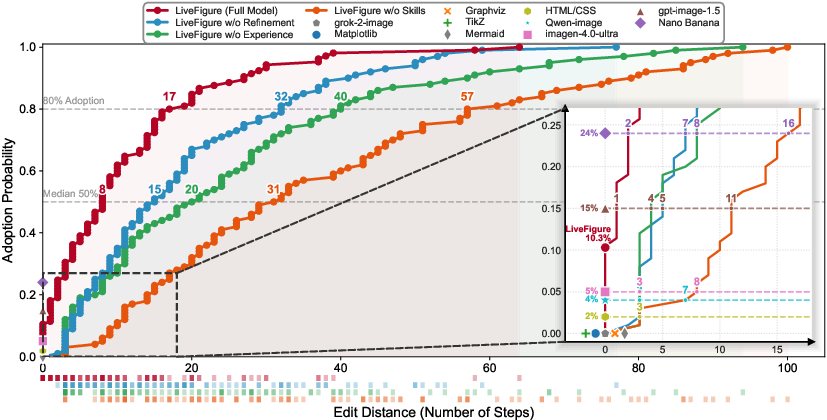
Figure 3: Edit Distance analysis shows dominant adoption efficiency for LiveFigure versus baselines and ablation variants.
Ablation studies reveal that the Skill Library and Experience Injection modules are critical: removing skills quadruples the median edit distance, while removing experience constraints reduces executability to 40%. Visual evaluation (nine metrics spanning Visual Design, Information Clarity, and Content Fidelity) confirms LiveFigure's superior scores, notably in accuracy and completeness under detailed input settings.
Human Preference Study
A double-blind human preference evaluation with domain experts demonstrates LiveFigure's statistically significant superiority. Adjusted win rates exceed 97% against code-based tools, and reach 69% against Nano Banana and 60% against GPT-image-1.5.
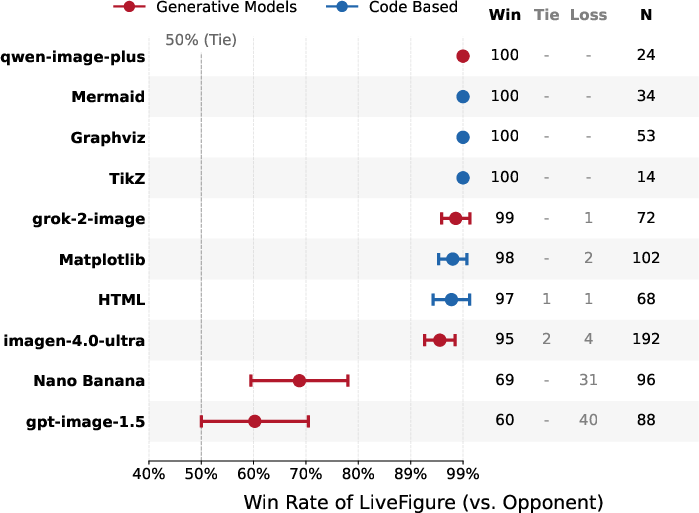
Figure 4: Head-to-head human preference evaluation indicates strong favorability for LiveFigure across both code-based and generative model baselines.
Qualitative Case Studies
Extensive qualitative analyses show that LiveFigure consistently reconstructs structural hierarchy and logical flow for diverse scientific schematics, handling complex multi-panel layouts and maintaining publication-friendly aspect ratios. Cross-model comparisons on challenging cases highlight the limitations of raster-based models (aspect ratio constraints, artistic but inaccurate logic) and code-based plotting tools (rigidity, poor semantic separation).
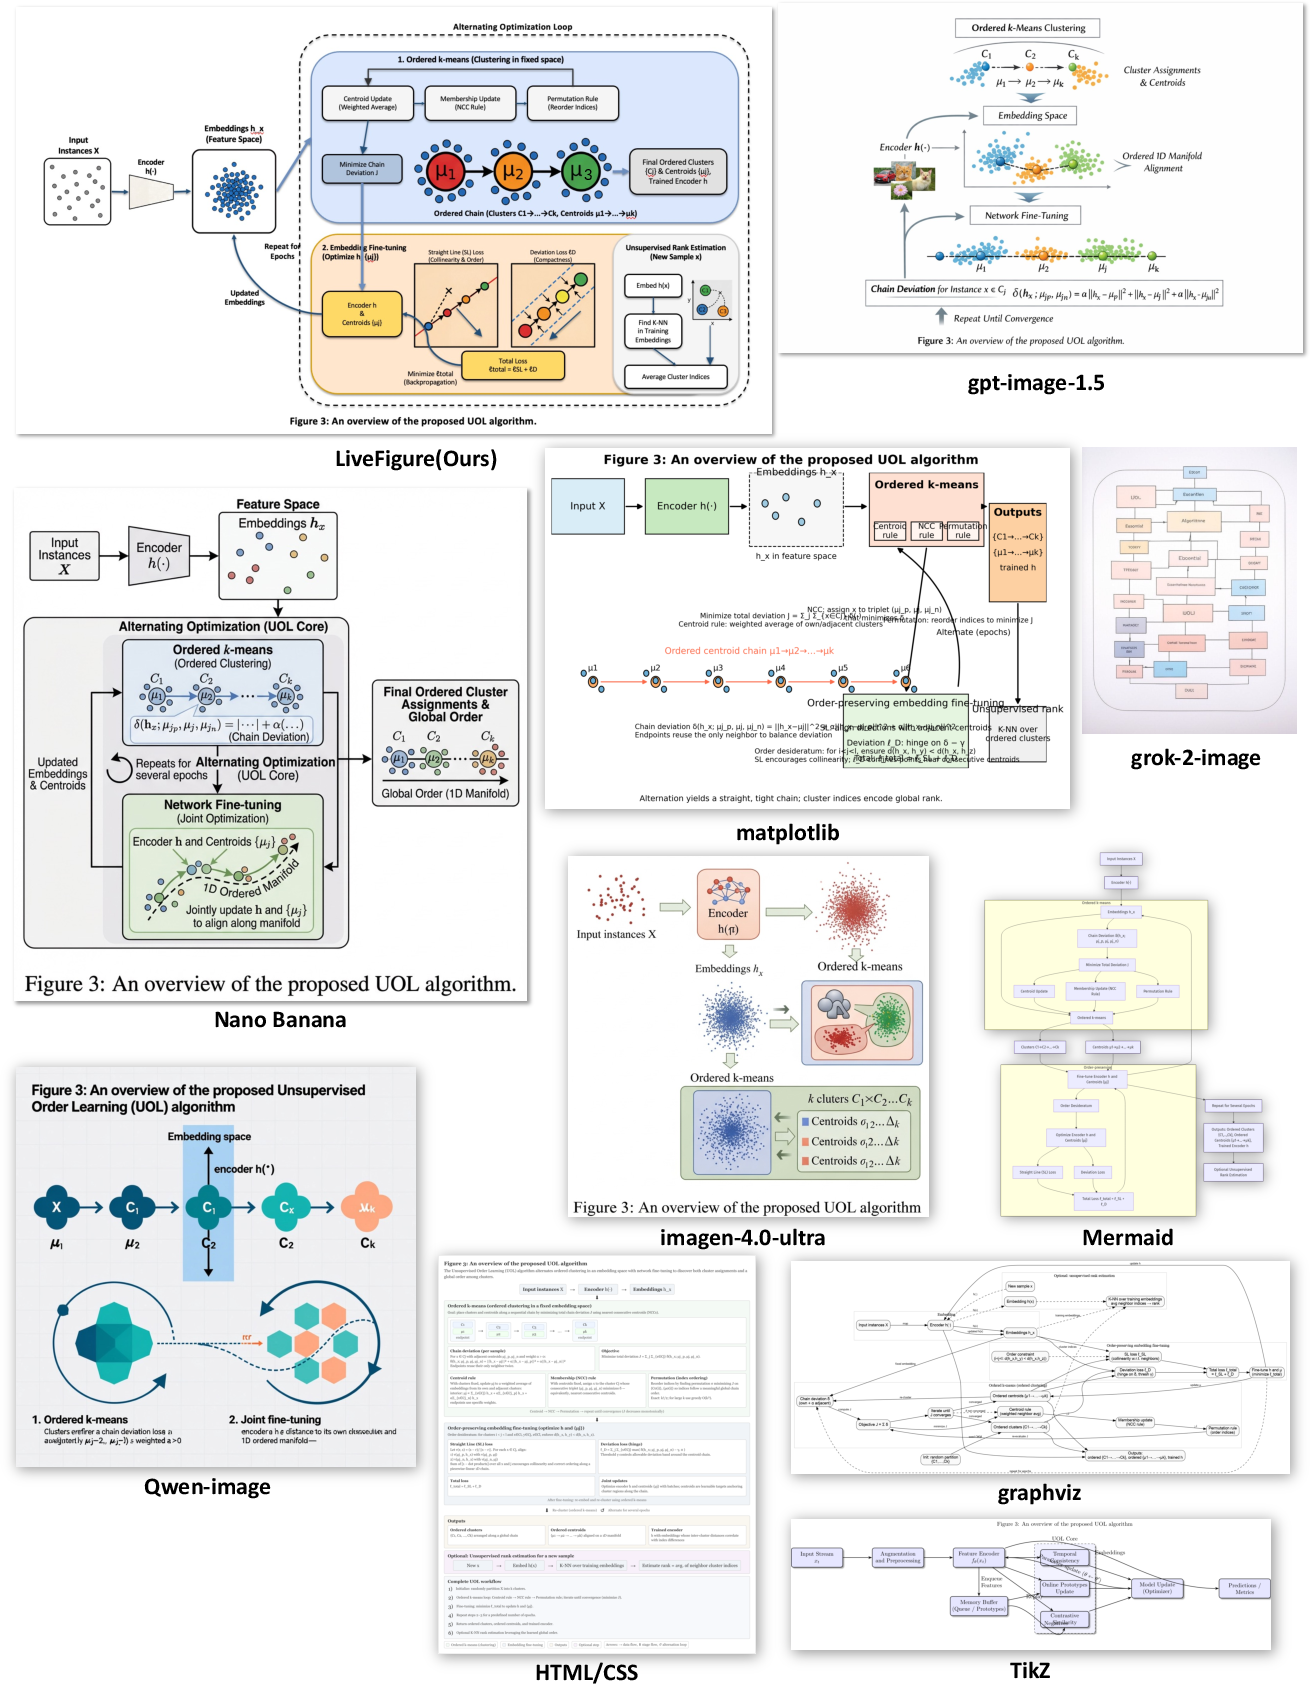
Figure 5: Comparison for unsupervised order learning shows superior hierarchical organization and canvas adaptability for LiveFigure.
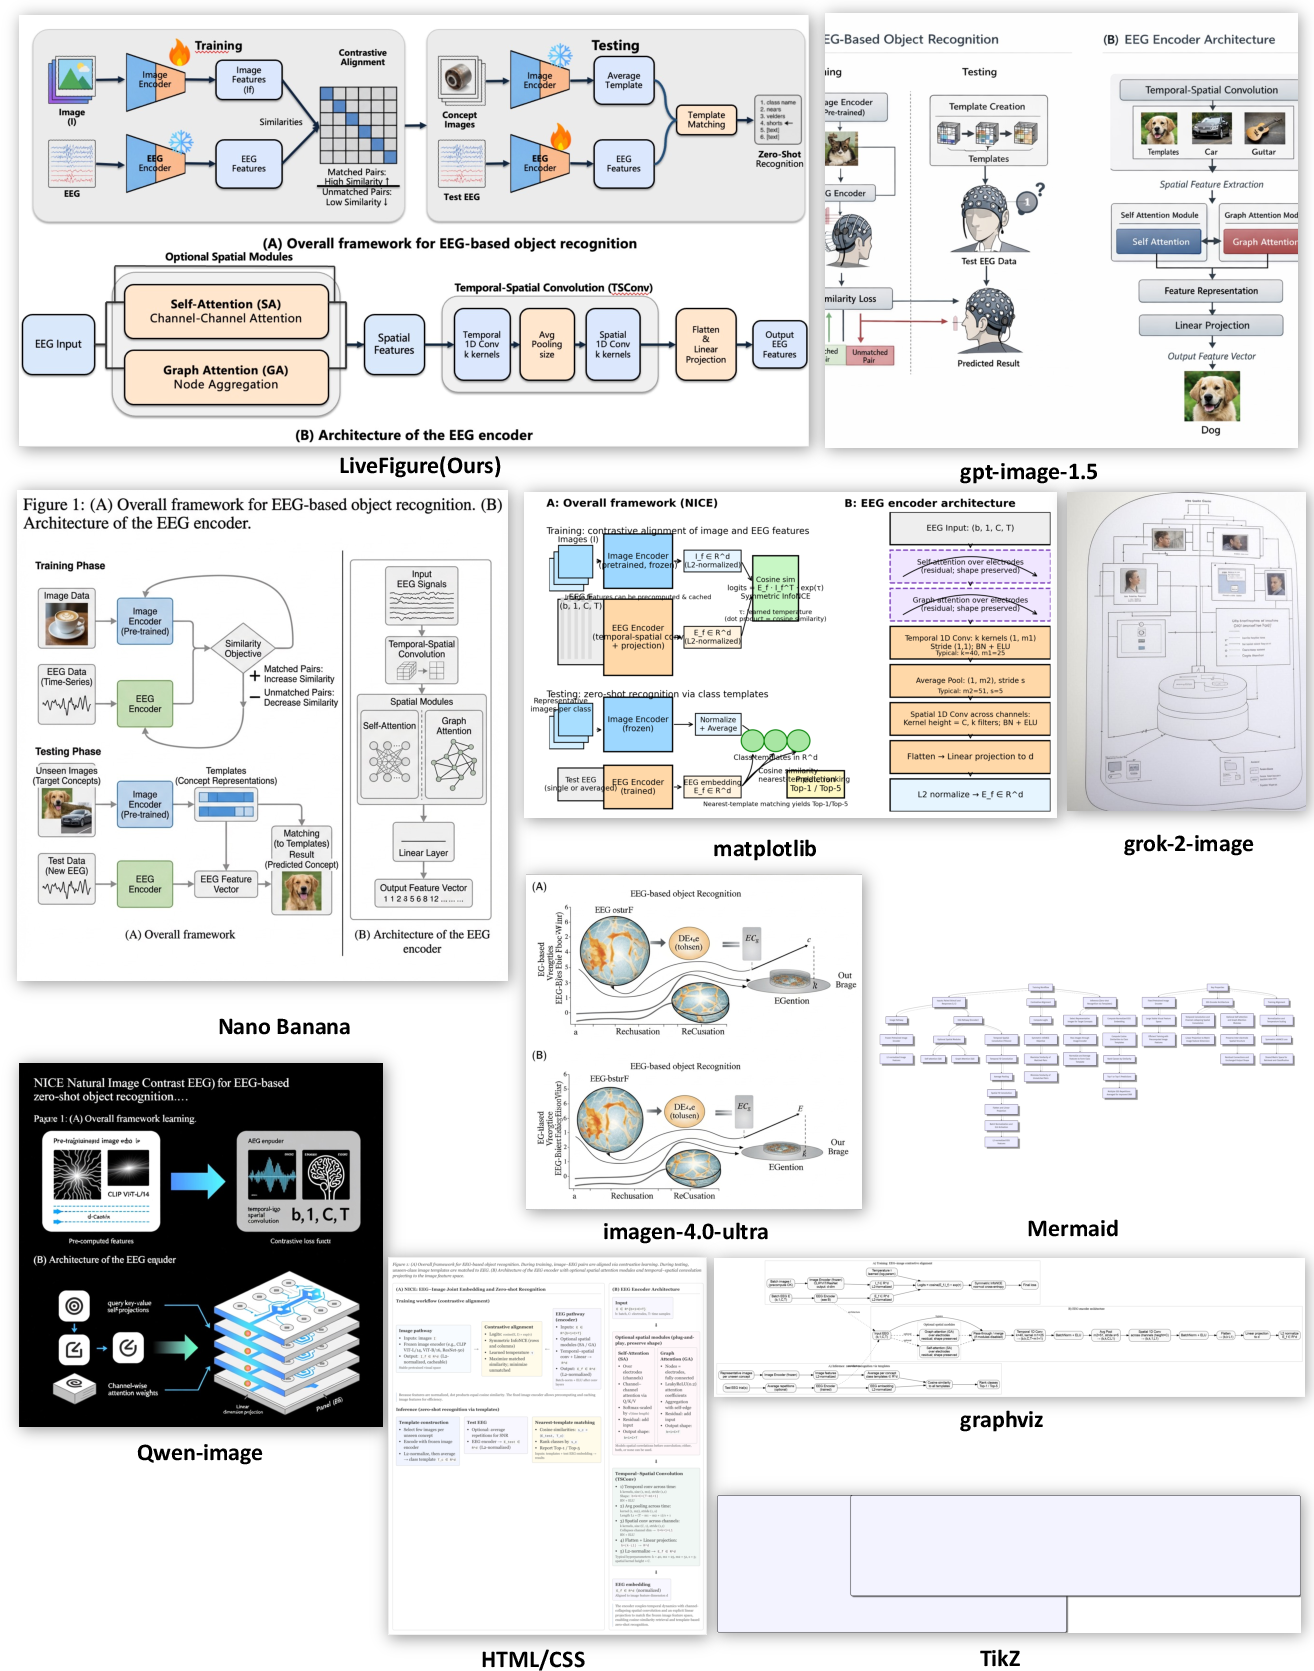
Figure 6: Comparison on EEG decoding exemplifies LiveFigure’s ability to disentangle complex multi-panel structures.
Editability is visually verified—LiveFigure outputs natively manipulatable objects, enabling precise modification of shapes, text, and connectors in PowerPoint, unlike raster images.
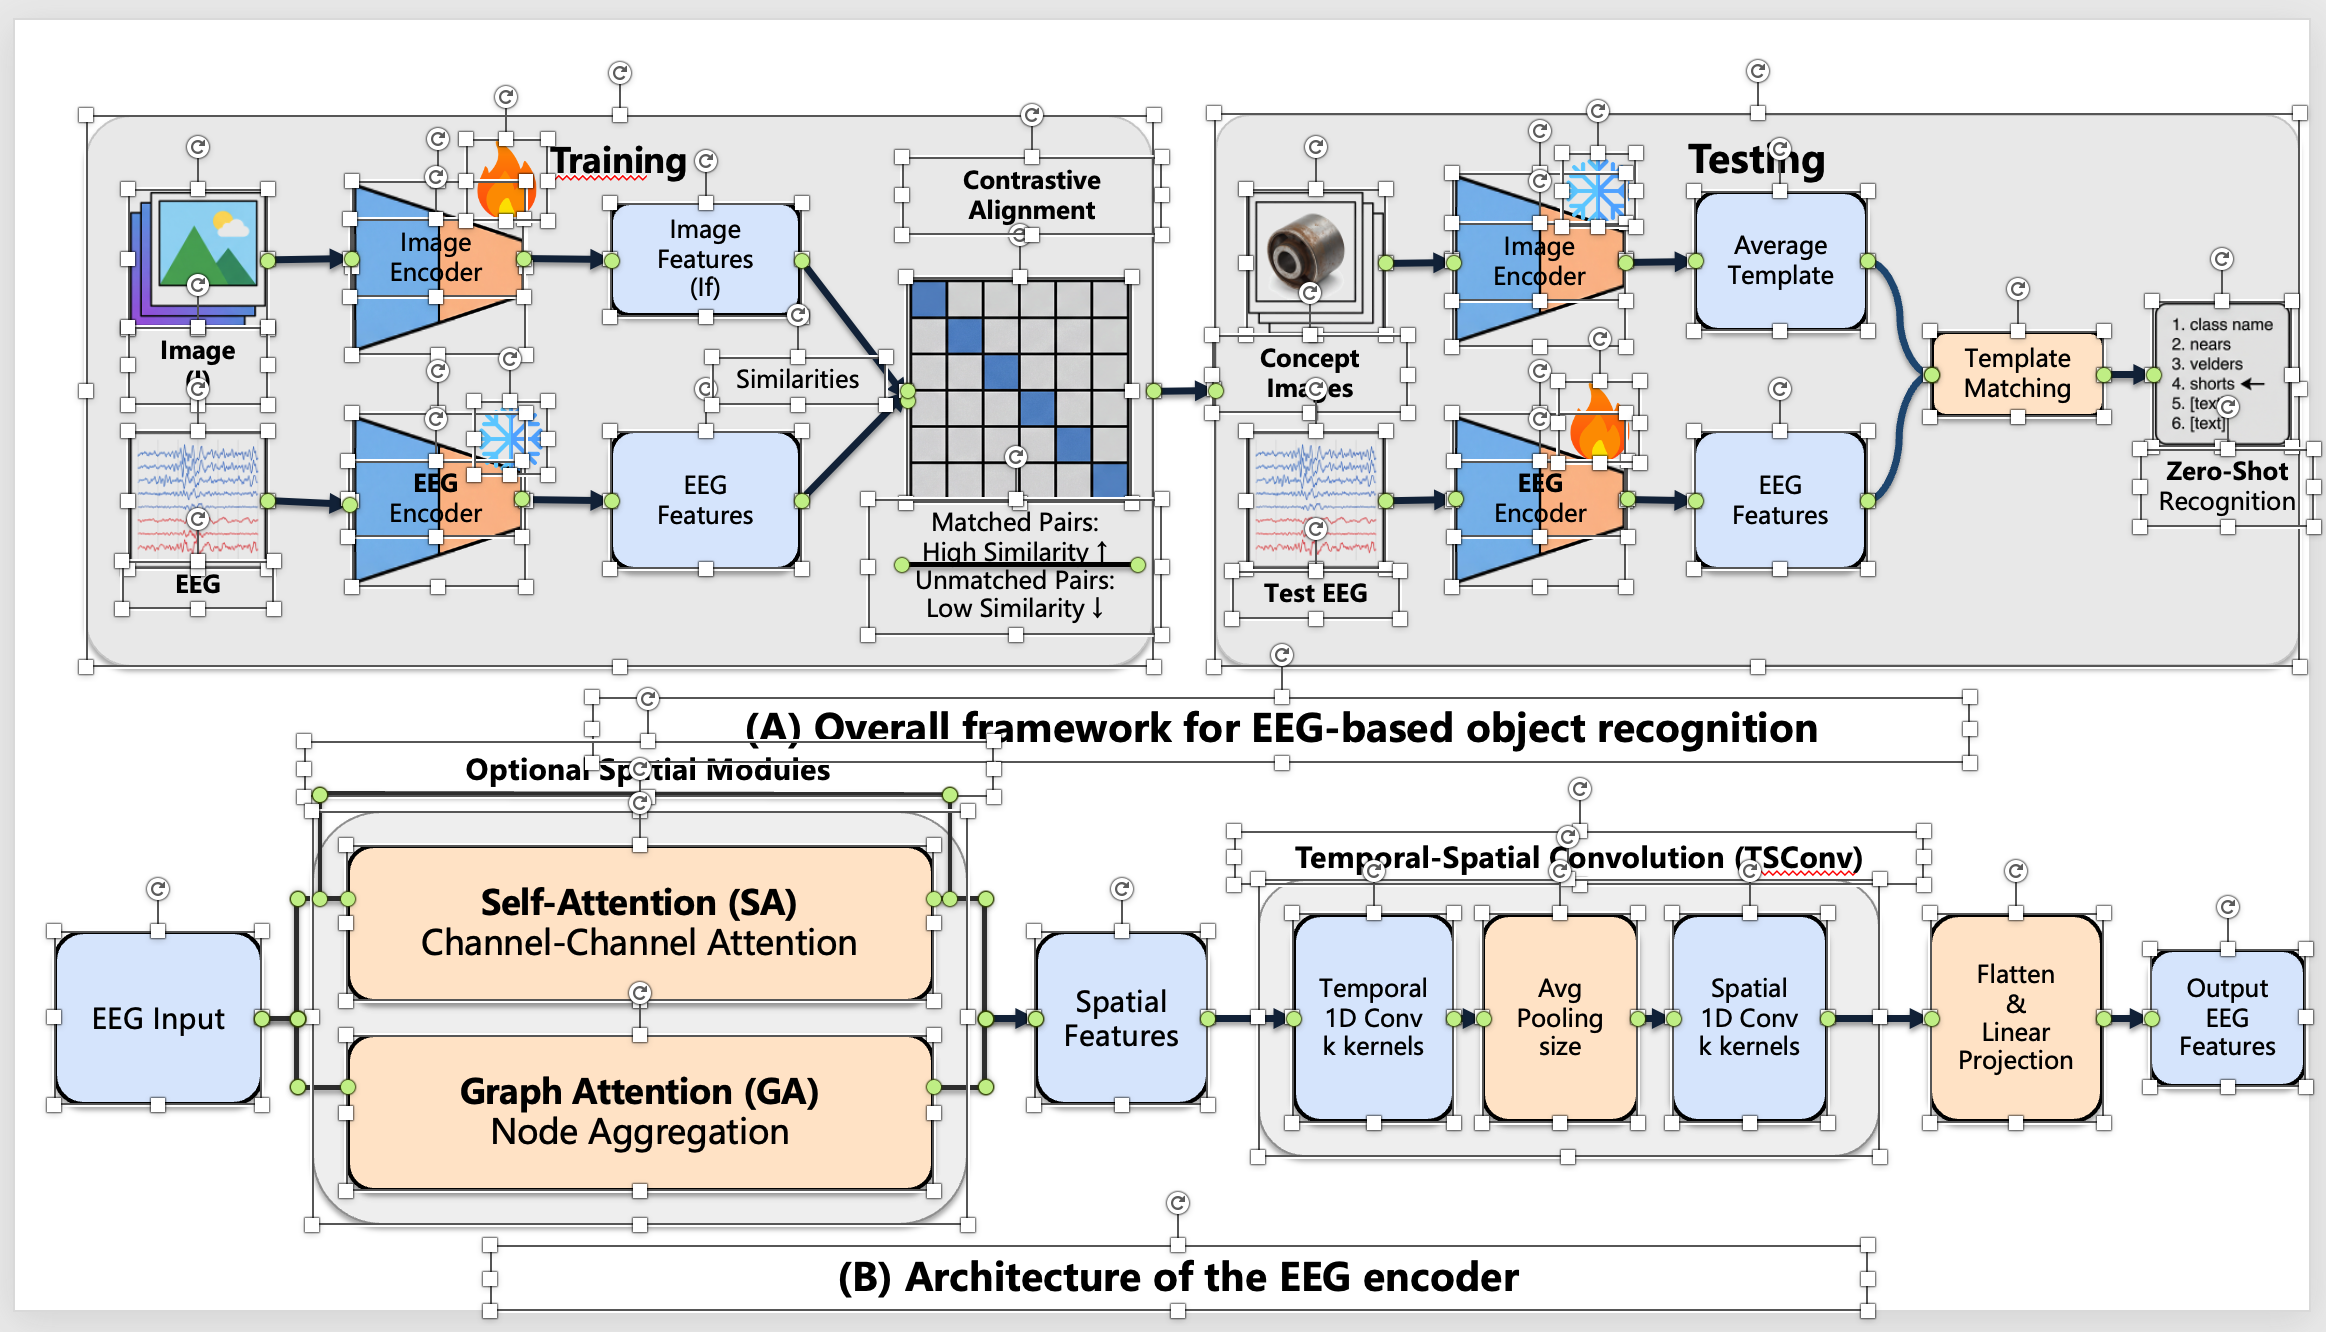
Figure 7: Screenshot of generated PPTX with all elements selected, evidencing full native editability and object granularity.
Generalization across scientific domains, such as biological workflow schematics, demonstrates flexible asset generation and object-level integration.
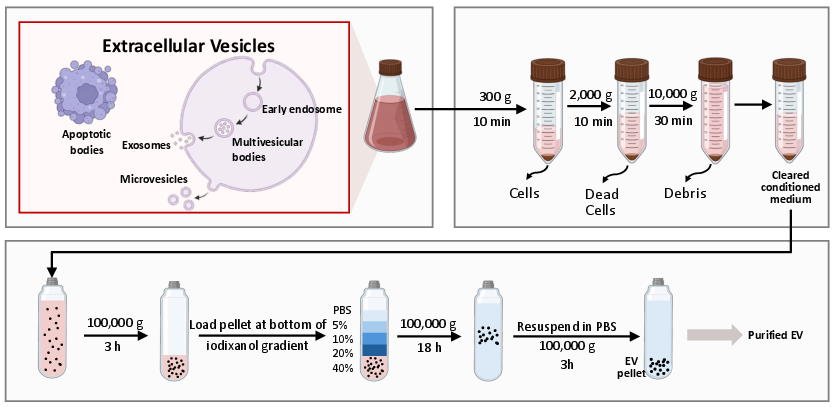
Figure 8: Example of LiveFigure-generated biological workflow schematic with native editability.
Failure Cases and Limitations
In highly dense system architectures, automated connector routing may produce visually crowded layouts ("spaghetti routing"). Thanks to native editability, these artifacts are manually correctable within seconds via anchor adjustment in PowerPoint.
Figure 9: Example of a dense diagram with connector overlap, easily rectified via manual intervention.
Natural Language-Based Interactive Modification
LiveFigure supports precise iterative modification driven by consecutive natural language instructions. The code-driven paradigm ensures that only targeted elements are updated, preserving overall structure and layout integrity.
Figure 10: Sequential natural language instructions yield targeted, topology-preserving modifications.
Implications and Future Directions
LiveFigure demonstrates that cognition-inspired procedural construction powered by VLM agents can overcome the core limitations of raster-based generative models and traditional code-based plotting tools. Natively editable, publication-ready figures democratize scientific communication workflows and enable seamless human-AI collaboration. Moving forward, the framework can be extended to multi-modal input modalities (e.g., hand-drawn sketches) and more granular author or venue preference alignment using RLHF and stylistic adapters. The paradigm offers a principled approach for fully autonomous, interactive research assistants capable of addressing both structural fidelity and aesthetic demands of diverse scientific disciplines.
Conclusion
LiveFigure operationalizes a staged, agent-driven pipeline for scientific schematic generation, achieving strong editability, high adoption rates, and competitive visual fidelity. The method bridges the gap between AI-driven automation and professional design standards, substantiating both the practical usability and theoretical soundness of cognition-inspired figure construction. The implications for AI-driven research communication are substantial, with directions for further expansion in personalized styling and generalized diagrammatic reasoning.

