- The paper demonstrates that high-frequency TDD bands are inherently limited in uplink by power constraints and restricted slot allocation.
- It utilizes rigorous, real-world measurements in an 80,000-seat stadium to analyze spectral allocation across multiple MNOs.
- Findings reveal that legacy FDD bands outperform TDD for uplink, underscoring the need for adaptive network configurations and spectrum policy reforms.
Introduction
The paper "Comprehensive Analysis of Cellular Uplink Performance in a Dense Stadium Deployment" (2604.04371) provides a systematic empirical investigation into uplink performance constraints within commercial 5G networks under extreme user densities, focusing on the interaction of band selection, duplexing architecture (TDD/FDD), and UE power constraints. Measurements were performed at the University of Notre Dame’s 80,000-seat stadium, capturing both pregame (low load) and game day (highly loaded) conditions. Supplemental measurements were also taken proximate to a Verizon Cell on Wheels (COW) deployment. The study utilizes commercial off-the-shelf smartphones and decodes PHY-layer events with the Rohde & Schwarz QualiPoc tool, enabling granular analysis of MCS, PRB allocations, and throughput statistics.
Experimental Design and Measurement Campaign
A robust measurement protocol is described wherein UEs collected data consistently across predefined spatial locations in the stadium's seating bowl (Figure 1), and surrounding the COW in the parking lot (Figure 2). The campaign targeted all major MNOs (AT&T, T-Mobile, Verizon), using premium devices and subscriptions to probe peak network capabilities and minimize bottlenecks extrinsic to the radio link. The spectrum utilized covered both low- and high-frequency FDD (e.g., b5, b13, n71, n25) and TDD bands (notably C-band n77 for Verizon, and n41 for T-Mobile). Carrier aggregation was limited to LTE+NR due to UE capabilities, with uplink carrier aggregation between two NR bands not supported.
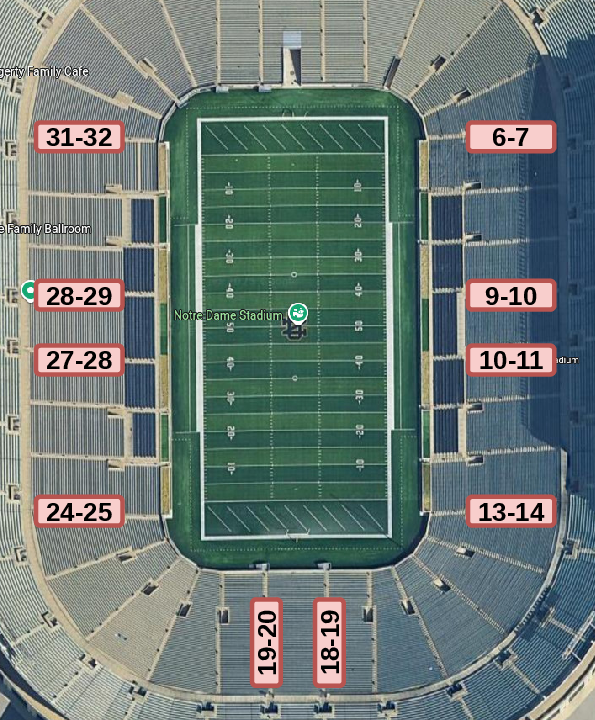
Figure 1: Physical layout and measurement spot distribution in the stadium seating bowl defined for the data collection regime.
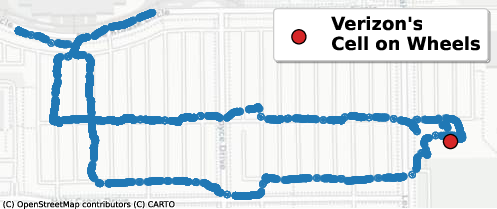
Figure 2: Spatial footprint of measurement points in the stadium parking lot focusing on the Verizon COW deployment.
Downlink-Uplink Asymmetry: Band, Power, and Scheduling Constraints
The core empirical finding is the severe, persistent disparity between downlink and uplink performance on high-frequency wideband TDD carriers. Despite UEs consistently operating near 3GPP maximum transmit power (23 dBm for n41, 26 dBm for n77), uplink MCS on these bands is significantly degraded relative to lower-frequency FDD alternatives, both under loaded (game day) and unloaded (pregame) scenarios (Figure 3). This limitation precedes user congestion and is fundamentally rooted in power-limited propagation and band-specific link budgets.
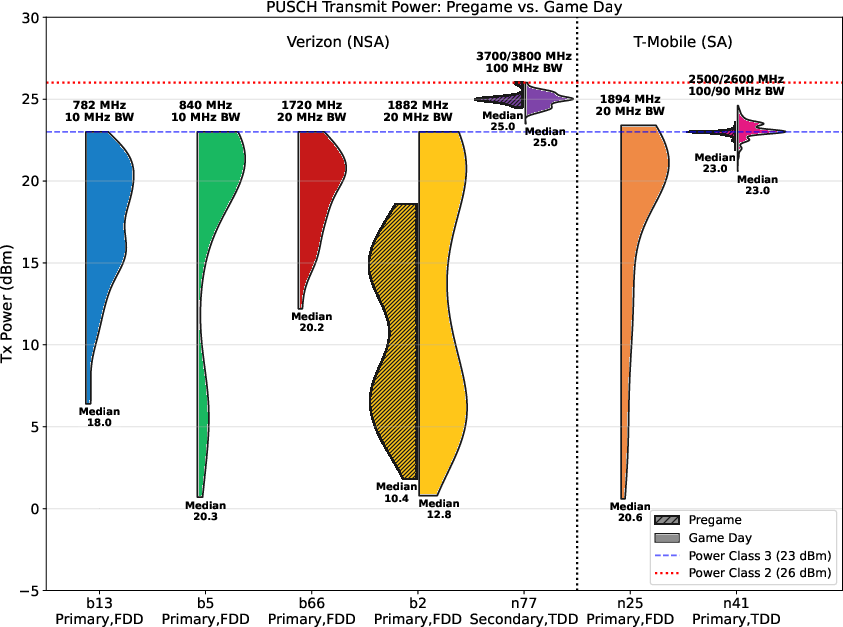
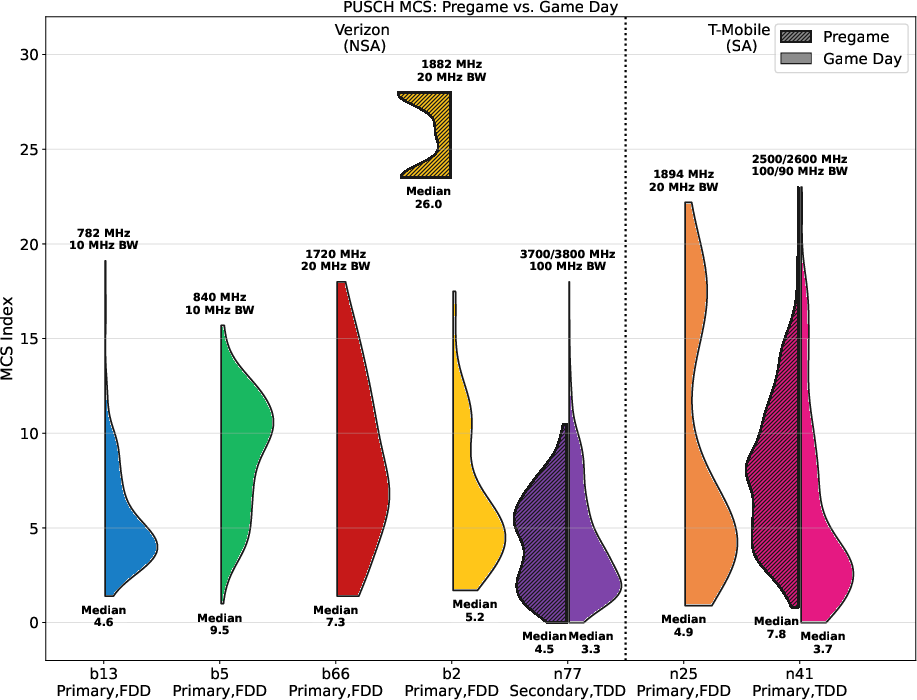
Figure 3: Distributions of uplink transmit power and resulting MCS for TDD and FDD bands under loaded and unloaded conditions; high-frequency TDD bands are power-saturated but MCS-limited.
Further dissecting resource allocation, the study finds that the PRB allocation disparity between the downlink and uplink is substantial for high-frequency TDD bands (Figure 4), and persists even in the absence of load. This reveals that the spectral benefit of wideband TDD carriers is not practically accessible to UEs due to physical transmit power constraints, resulting in limited usable bandwidth for uplink even under ideal conditions.
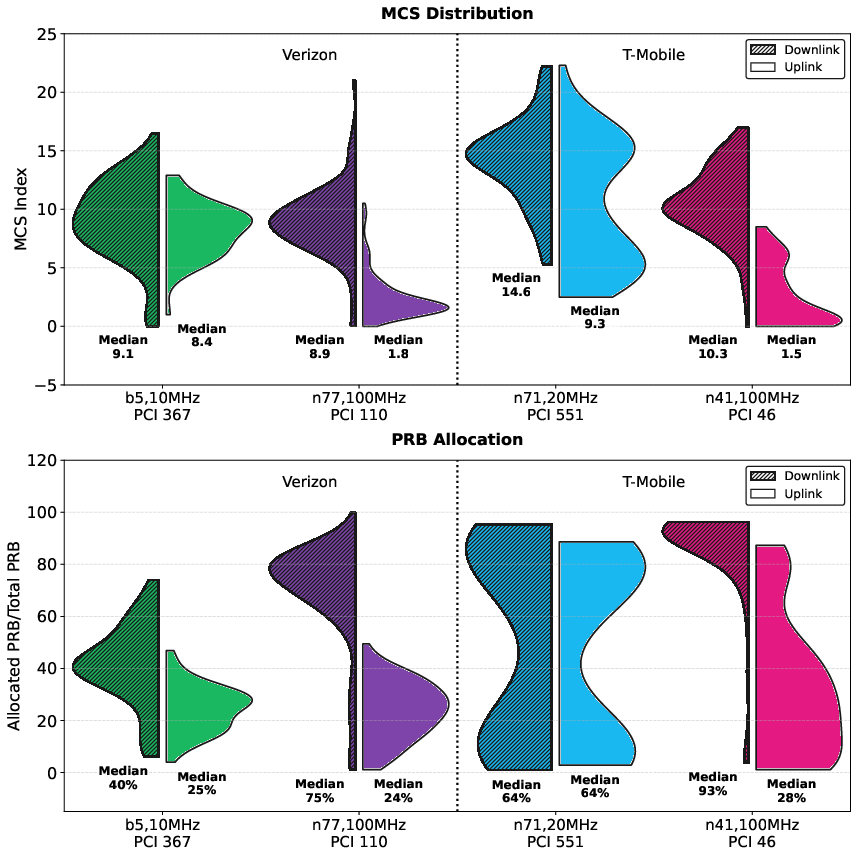
Figure 4: Median DL–UL difference in PRB allocation ratio across network load scenarios; persistent spectral access asymmetry on high-frequency TDD bands.
Uplink Traffic Distribution in High-Density Environments
Carrier combination and throughput analysis confirms the network’s heavy reliance on low-frequency FDD bands for uplink during load spikes. Verizon’s anchor selection shifts predominantly to sub-1 GHz bands on game day, with b5 and b13 serving as primary uplink bearers in NSA mode (Figure 5). The n77 (100 MHz TDD) contribution to overall uplink throughput remains below 20% in loaded conditions (Figure 6), despite orders-of-magnitude bandwidth advantage and higher transmit power, due to persistent low MCS and PRB allocation.
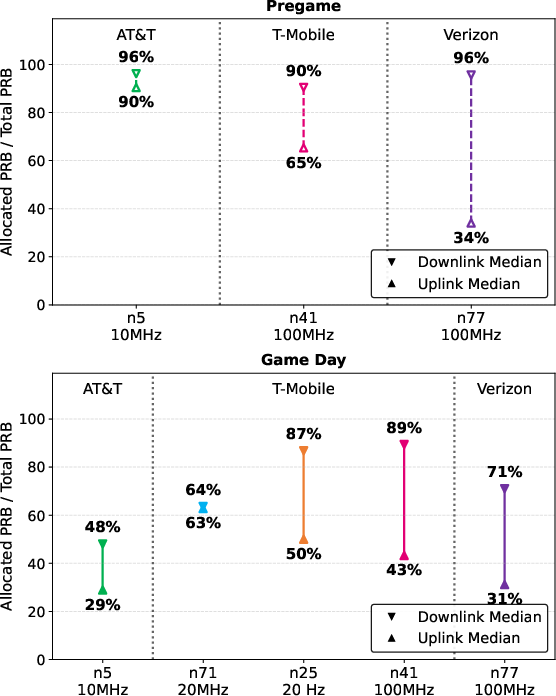
Figure 5: Distribution of Verizon uplink anchor selection; strong growth in low-frequency (b5/b13) FDD utilization during congestion.
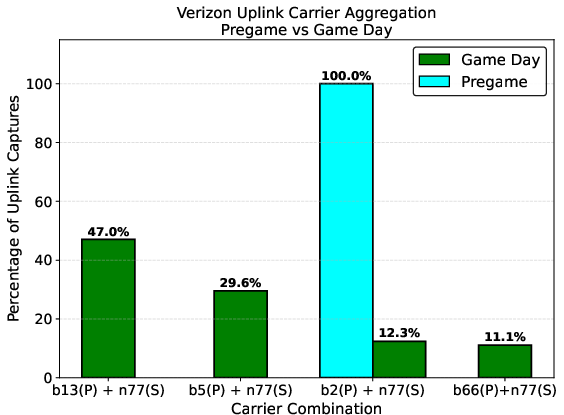
Figure 6: Fraction of uplink throughput (CDF) carried by Verizon’s n77 TDD band in pregame and game day conditions; n77 offers limited uplink capacity despite high spectral resources.
A granular breakdown of per-band throughput distributions underscores the magnitude of this asymmetry: while n77 and n41 bands dominate downlink traffic, sub-1 GHz FDD carriers provide the overwhelming majority of uplink throughput (Figure 7). Similar trends are observed for T-Mobile deployments, with uplink carrier aggregation to n71 (677 MHz) outperforming n41 (2500/2600 MHz) for median NSA uplink throughput on game day (Figure 8).
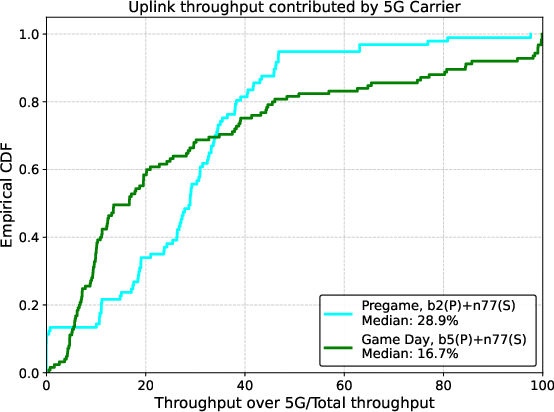
Figure 7: Visualization of downlink and uplink throughput achieved per band for Verizon; high-frequency TDD is downlink-oriented while FDD bands excel in uplink.
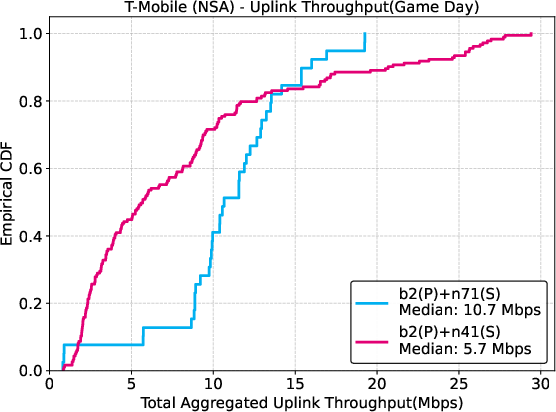
Figure 8: CDF of total uplink throughput for T-Mobile NSA, illustrating performance superiority of low-frequency n71 FDD aggregation.
Structural Limitations of TDD Duplexing and FDD Superiority in Uplink
The study demonstrates that even under advantageous propagation scenarios (i.e., strong LOS and elevated MCS in proximity to the Verizon COW), high-frequency TDD bands remain structurally throttled in the uplink. Despite power headroom and high MCS, the downlink-heavy slot configuration of TDD significantly truncates available uplink opportunities, ensuring that the FDD anchor (b66) supersedes n77 in median uplink throughput by ~4x (Figure 9).
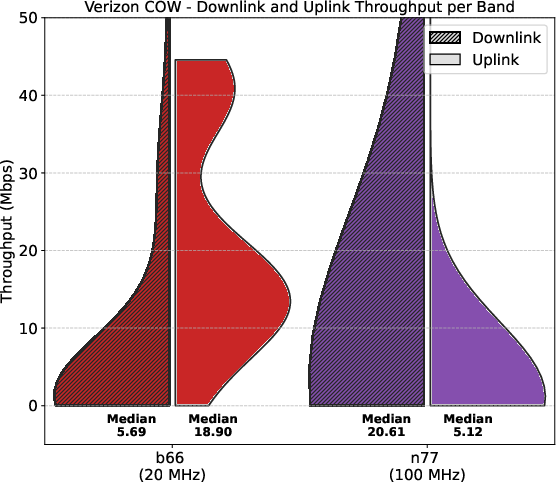
Figure 9: Downlink and uplink throughput achieved on COW-deployed n77 (TDD) and b66 (FDD) bands; FDD remains the uplink workhorse even with optimal TDD propagation.
A parallel analysis for T-Mobile’s SA mode (no CA, n25 vs. n41) corroborates this result under comparable MCS: n25 (FDD) achieves a median uplink throughput ~50% greater than n41 (TDD) despite the latter’s higher transmit power and wider bandwidth (Figure 10). This empirically supports the thesis that TDD’s temporal asymmetry, combined with spectral inefficiency under UE power constraints, is a fundamental impediment to uplink utility.
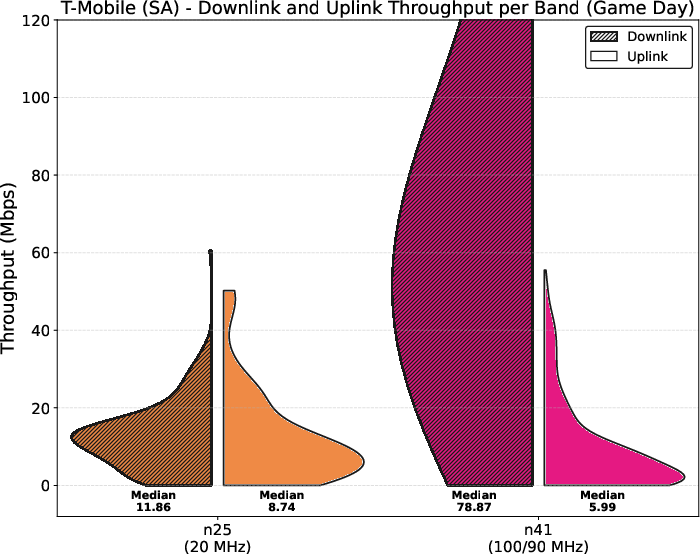
Figure 10: Uplink throughput comparison for T-Mobile SA FDD (n25) and TDD (n41); FDD band maintains a significant performance edge.
Practical and Theoretical Implications
The findings indicate that the emerging industry trend of deploying wideband high-frequency TDD spectrum for capacity expansion primarily benefits downlink traffic, while uplink requirements remain bound to legacy low-frequency FDD bands. The inability of UEs to utilize the full TDD channel for uplink—due not only to propagation loss but also restricted uplink slot allocation and persistent PRB underutilization—suggests that current TDD-centric 5G deployment strategies may undermine user experience for uplink-intensive applications in ultra-dense environments.
The results also challenge the effectiveness of network densification alone, highlighting that even in favorable propagation conditions (e.g., small cell proximity, high MCS), the intrinsic frame structure of TDD duplexing can bottleneck uplink resources. Uplink capacity in dense venues will thus remain strongly linked to operators’ FDD spectrum holdings and the design of more uplink-balanced frame configurations or dynamic slot adaptation at the RAN level.
Future Directions
This study points to several future research and engineering trajectories:
- Dynamic TDD Slot Reconfiguration: Mechanisms to temporally reallocate TDD uplink slots in response to contextual uplink demand and congestion.
- Distributed Uplink Offloading: Utilizing alternative RATs, Wi-Fi integration, or device-to-device relaying to offload uplink-intensive flows in venues.
- Joint PHY/MAC Optimization: Enhanced uplink scheduling algorithms and adaptive resource allocation aware of UE power limits, SNR, and application gradients.
- Spectrum Policy Considerations: Preservation or expansion of low-frequency uplink FDD allocations as a critical infrastructure consideration, particularly for mass event venues or contexts with significant uplink traffic surges.
Conclusion
This work provides a detailed, empirically grounded analysis of uplink performance in dense real-world 5G environments, with strong evidence that high-frequency TDD bands are innately disadvantaged for uplink transmission due to interaction effects among propagation physics, duplexing architecture, and power budgets. FDD bands consistently deliver superior uplink performance, both absolutely and as a fraction of capacity, in all tested configurations—including those with optimal propagation and MCS. This finding should inform both the theoretical design of future cellular architectures and practical spectrum management and deployment strategies, especially as uplink demand continues to rise with new application classes.

