- The paper introduces Effective Dimensionality (ED) as a novel metric that quantifies the independent signals in benchmarks via spectral analysis of the task-by-model score matrix.
- It demonstrates that many evaluation suites, tested across 22 benchmarks and 8,400 model evaluations, suffer from severe redundancy and compress to far fewer independent dimensions than expected.
- The study provides actionable guidelines and the ED-Greedy algorithm for benchmark maintainers, helping to detect redundancy, manage benchmark aging, and improve evaluation fidelity.
BenchScope: Spectral Analysis of Benchmark Redundancy and Breadth in AI Evaluation
Introduction and Motivation
As the AI community rapidly proliferates evaluation suites and leaderboards, the lack of rigorous, quantitative diagnostics for benchmark redundancy undermines the informativeness of model rankings and impedes principled suite design. BenchScope addresses this gap by introducing the concept of Effective Dimensionality (ED), which quantifies the number of independent signals a benchmark suite provides. ED is obtained via the participation ratio of the singular value spectrum of the task-by-model score matrix, computed at the per-instance level for maximal granularity. This formalism enables large-scale, fine-grained screening of redundancy, measurement breadth, and structural fragility, as applied to 22 benchmarks and over 8,400 model evaluations.
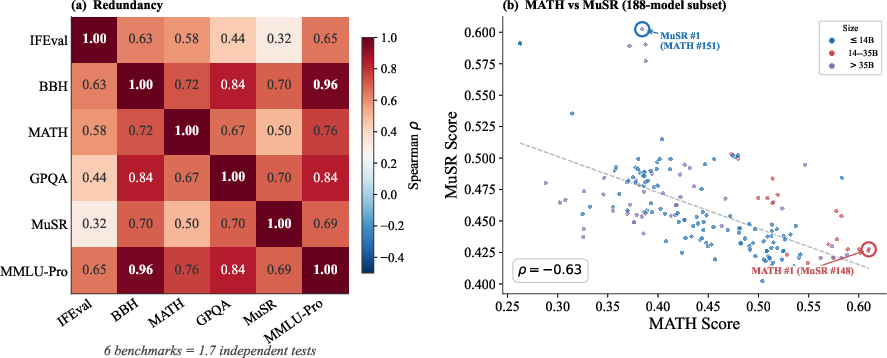
Figure 1: Redundancy structure in the Open LLM Leaderboard v2, with strikingly high pairwise correlation (BBH vs. MMLU-Pro, ρ=0.96) and severe reduction of effective axes (ED=1.7 of 6).
Effective Dimensionality: Methodology and Theoretical Foundation
The ED metric is defined as the participation ratio of the squared singular value spectrum of a task-centered binary pass/fail matrix. Formally, for singular values σi from the SVD of a mean-centered T×N matrix:
ED=∑iσi4(∑iσi2)2
This scalar reflects an upper bound on the number of meaningful, independent axes of variation by which current models are discriminated in the benchmark. The interpretation is grounded in R\'enyi-2 entropy, and connections to random matrix theory (RMT) provide null baselines for assessing whether observed ED departs from the structure expected under i.i.d. entries.

Figure 2: ED computation pipeline, from task-centered binary pass/fail matrix to participation ratio via SVD; no iterative thresholding or permutations required.
Robustness checks include alternative centering, tetrachoric corrections for binary bias, and comparison to established metrics such as parallel analysis and IRT-based factor counting. Relative ED ordering is highly stable across controls (ρ=0.98 rank-order with ground truth in synthetic validation).
Benchmark Landscape: Cross-Ecosystem Empirical Atlas
Application of ED at per-instance granularity to 22 benchmarks spanning coding, reasoning, agentic, and general knowledge domains yields a comprehensive redundancy atlas. There is pronounced heterogeneity in empirical measurement breadth, with ED ranging over a factor of >20×. Notably:
- The Open LLM Leaderboard suite (6 tasks) compresses to ED=1.7; only ∼2 independent signals are measured.
- BBH and MMLU-Pro are near-perfectly redundant (ρ=0.96); inclusion of both inflates composite scores without informational gain.
- Function-calling (BFCL, 20 categories) collapses to ED=1.707 effective groups, and per-instance ED is 1.5—suggesting a single latent axis dominates.
- BigCodeBench achieves the highest empirical breadth (ED=29), but permutation null and split-half analyses show only ED=1.718–9 dimensions are statistically significant.
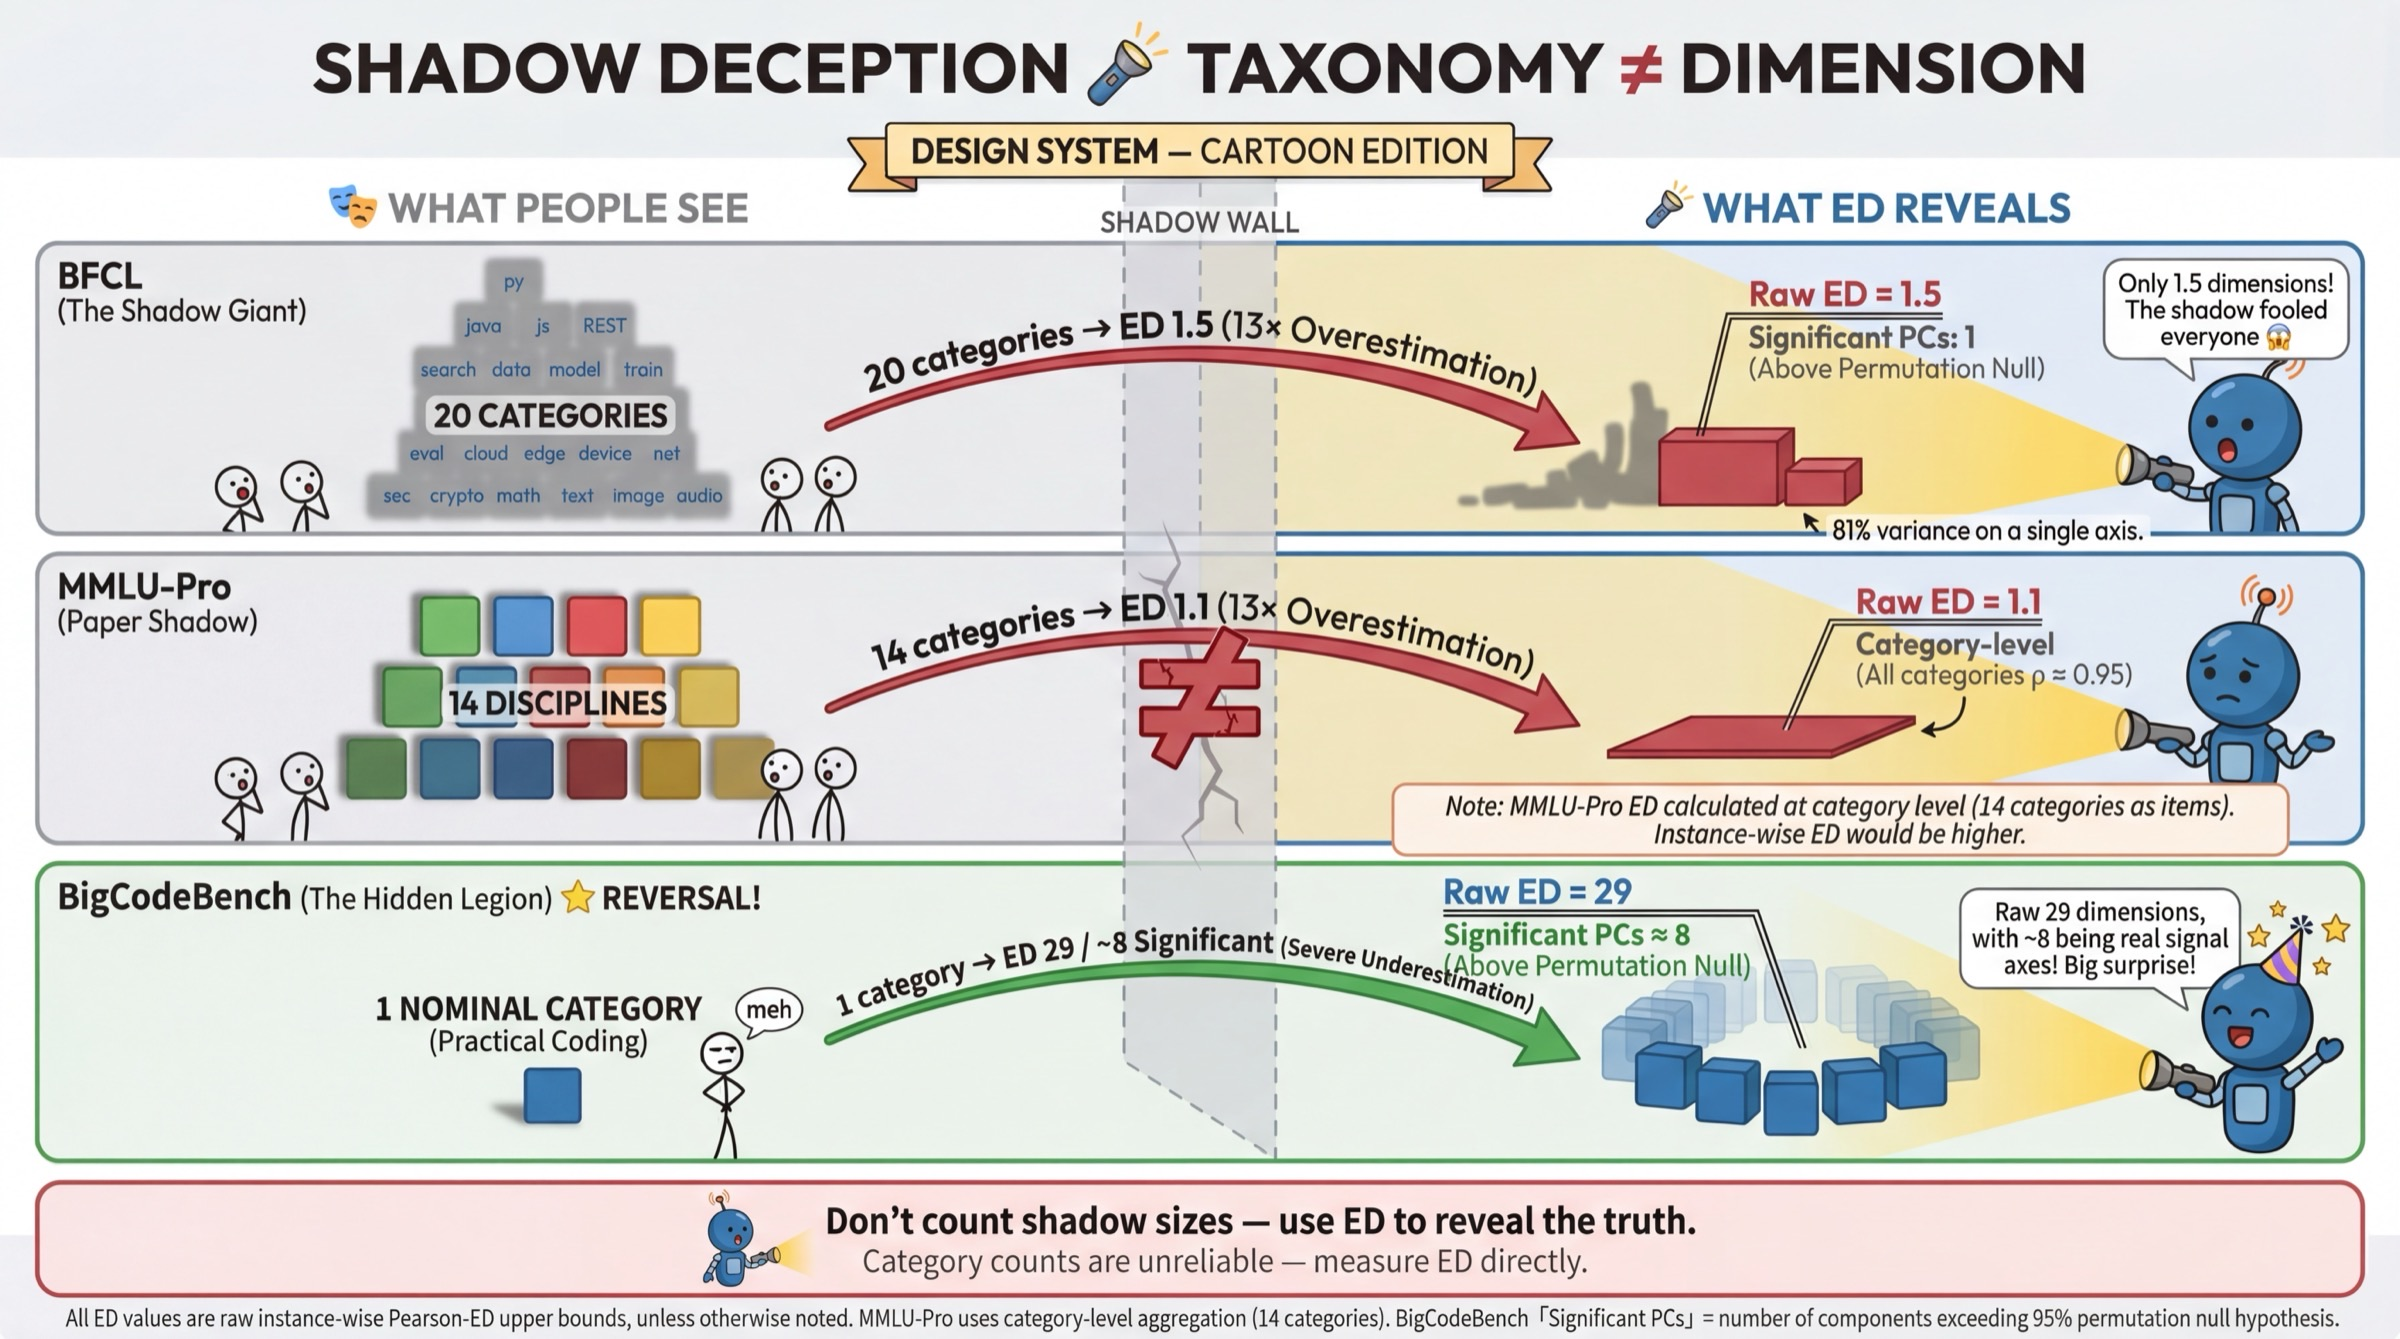
Figure 3: Claimed taxonomy size is poorly predictive of empirical measurement breadth; e.g., BFCL’s 20 categories (ED=1.5) vs. BigCodeBench’s single label (ED=29).
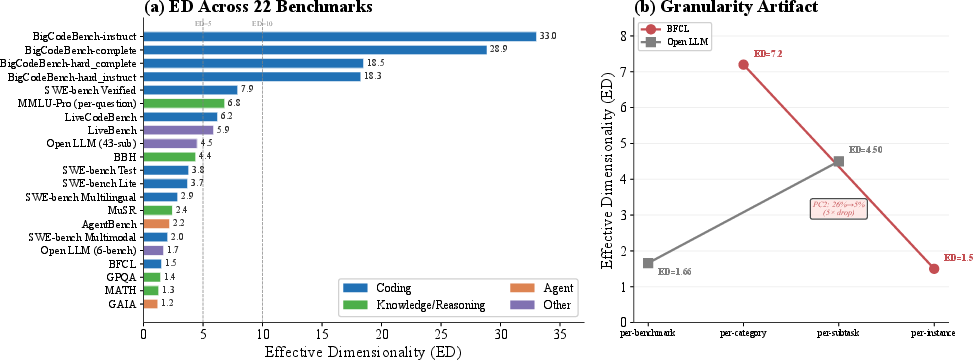
Figure 4: ED distribution across 22 benchmarks, sorted; extreme spread demonstrates substantial heterogeneity in discrimination capacity.
Crucially, claims of breadth grounded on category count or topical diversity are not supported empirically; structural heterogeneity among tasks, as captured by uncorrelated model performance patterns, is the actual driver of high ED.
Detailed Case Studies: Open LLM Leaderboard and Benchmark Tradeoffs
Analysis of the Open LLM Leaderboard exemplifies the phenomenon of both redundancy and conditional negative correlation. In aggregate, the six-score suite reduces to ED=1.721.7 effective dimensions. Pairwise correlation identifies BBH and MMLU-Pro as fully redundant within and across model subpopulations, while IFEval—showing only weak correlation with others—constitutes the suite’s only irreplaceable component.
Composite score fragility is empirically quantified: random benchmark weighting alters the leaderboard winner 38% of the time, and removing the most redundant benchmark changes the top model. Conditional negative correlations (e.g., MATH vs. MuSR, ED=1.73 within large models) further indicate that composite rankings face a correlation ceiling (ED=1.74), limiting the informativeness of any positive-weight composite when negative tradeoffs exist.
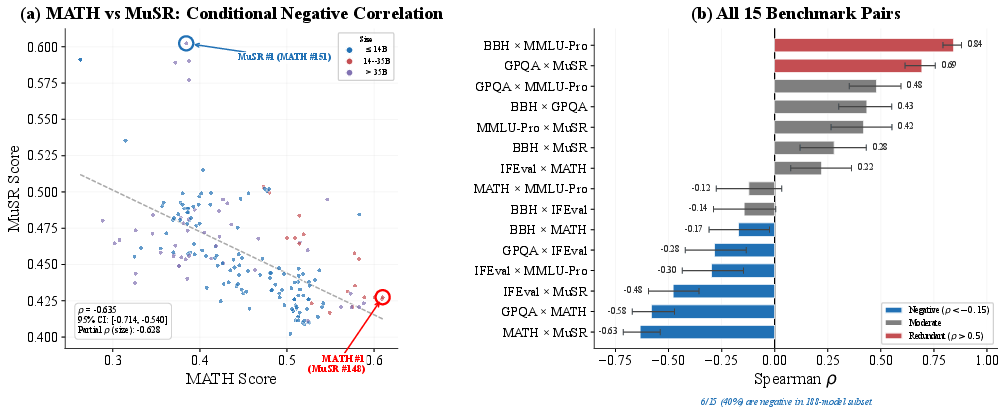
Figure 5: Pairwise performance correlations and negative tradeoff structure in the Open LLM Leaderboard; BBH/MMLU-Pro are redundant, MATH/MuSR exhibit a strong negative correlation in fixed-size subpopulations.
Drivers of Measurement Breadth: Structure over Taxonomy
Comprehensive controlled experiments disambiguate the sources of high ED. BigCodeBench’s high ED persists even when sampling 100 tasks from a single library—topic diversity barely matters. Instead, the chief determinant is structural heterogeneity, i.e., the diversity of logical, representational, or cognitive demands imposed by tasks, leading to uncorrelated pass/fail profile vectors. Conventional metrics such as library overlap or observable difficulty explain only minor variance in inter-task correlation.
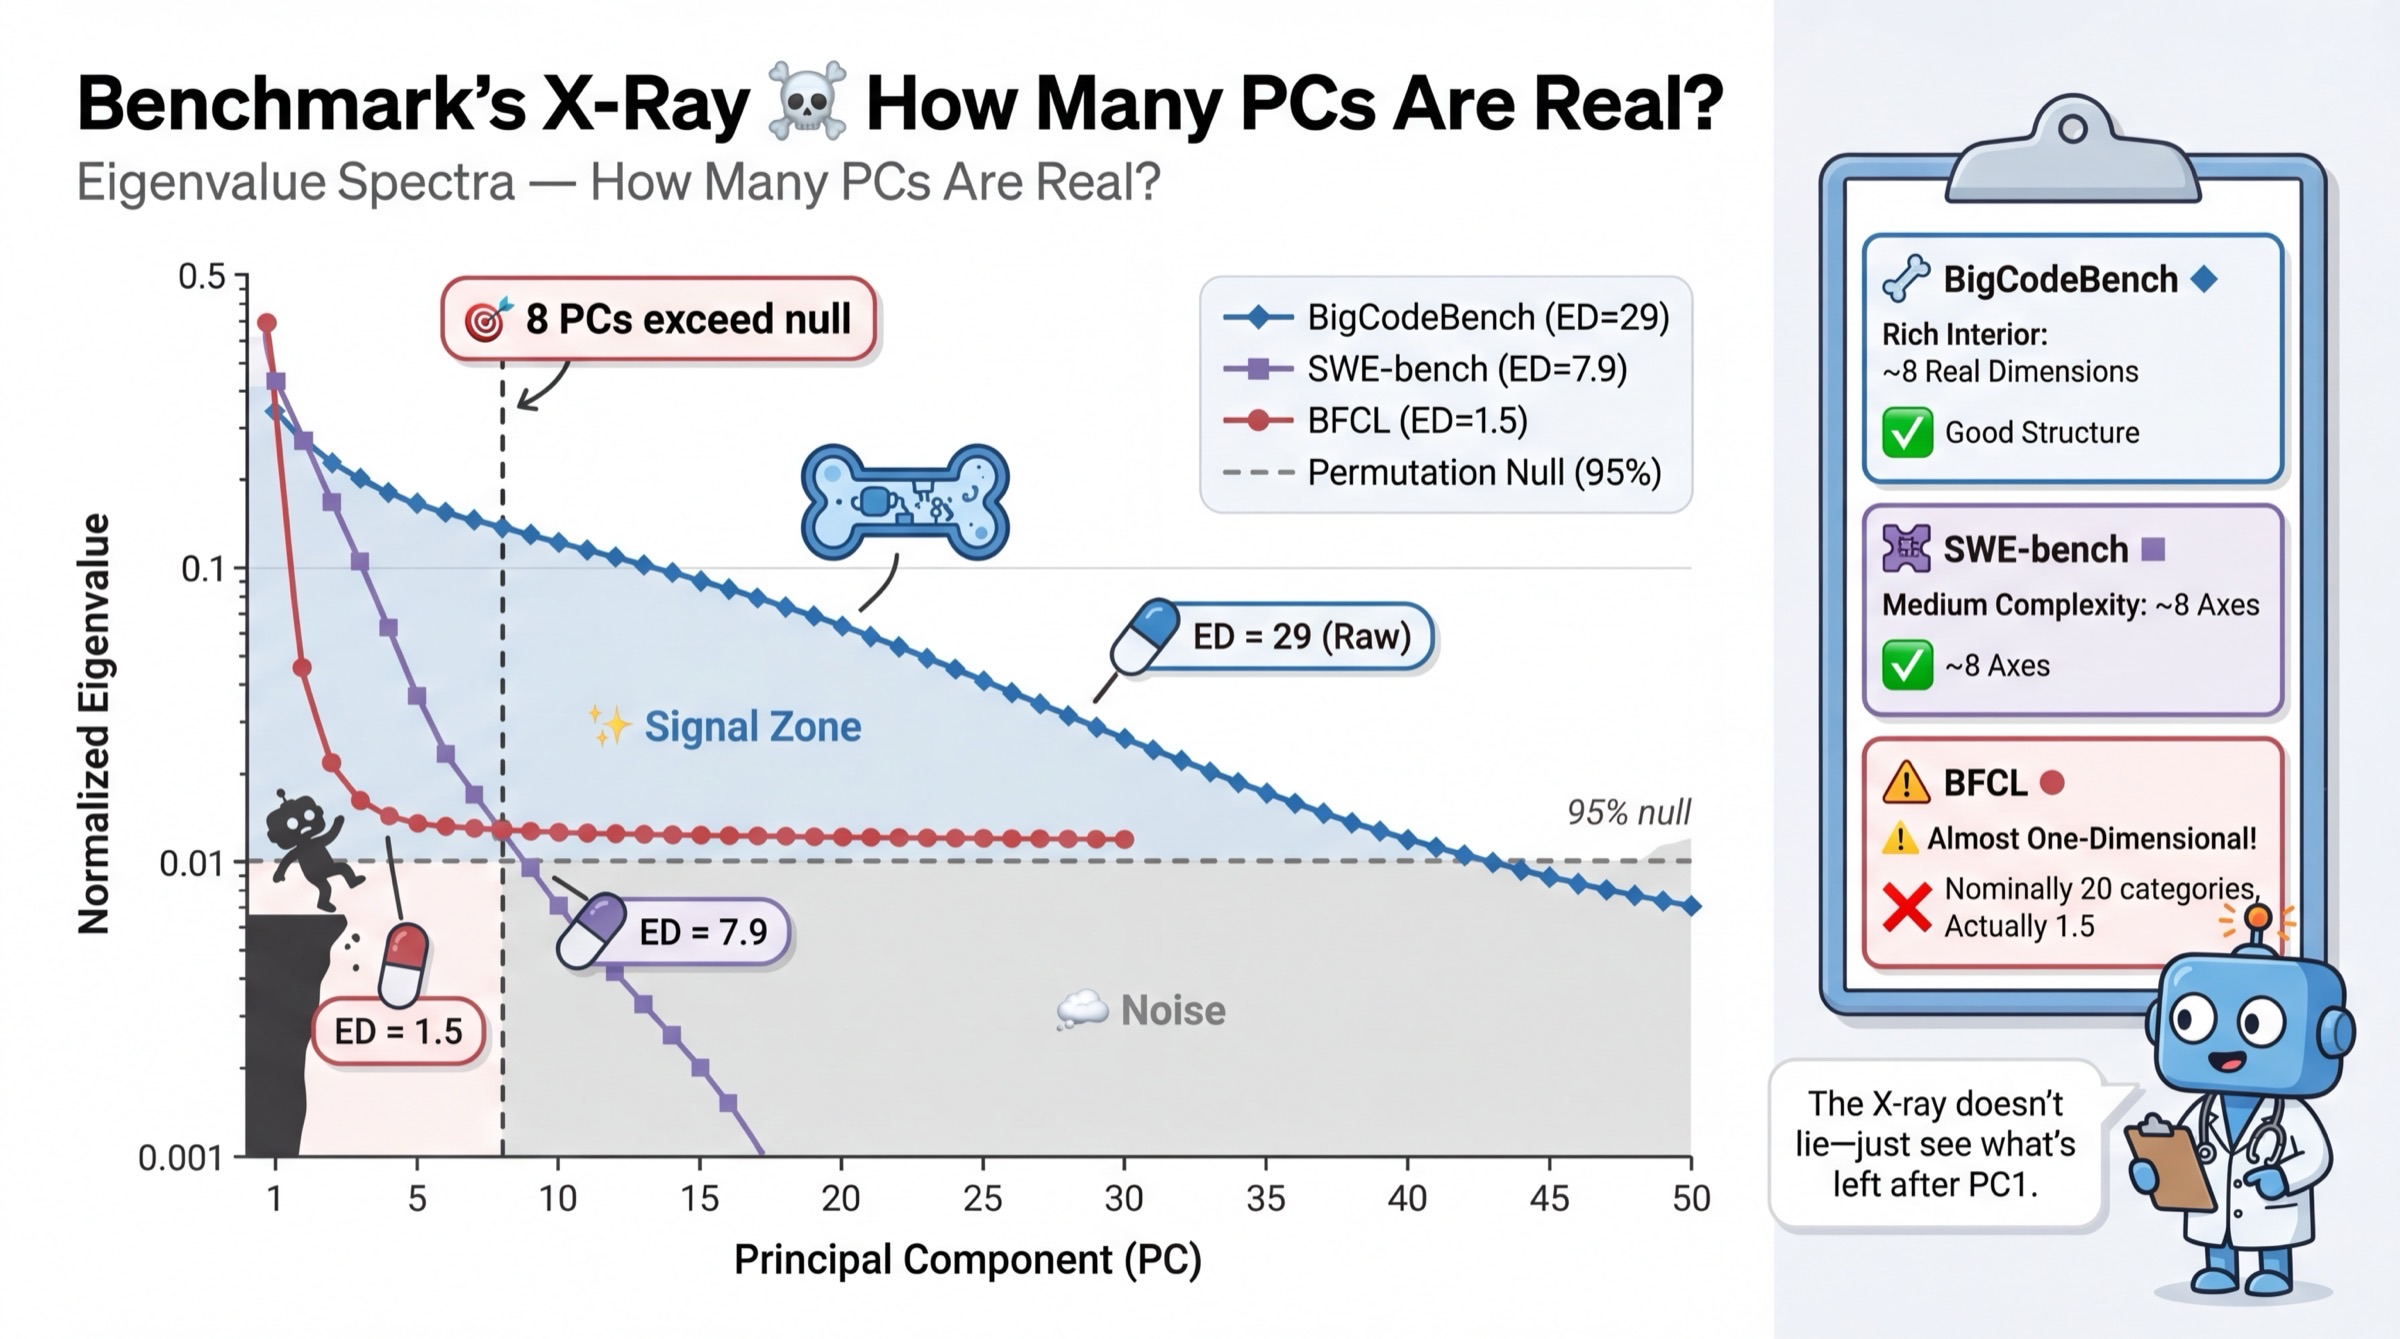
Figure 6: Eigenvalue spectra showing only a subset of PCs (principal components) exceed null; BigCodeBench has ED=1.758 significant PCs, while BFCL collapses to a single axis.
Saturation analyses further show that some benchmarks (e.g., SWE-bench) reach their maximum discriminative breadth with a small population, while others (BigCodeBench) require substantially more models to fully reveal latent capacity.
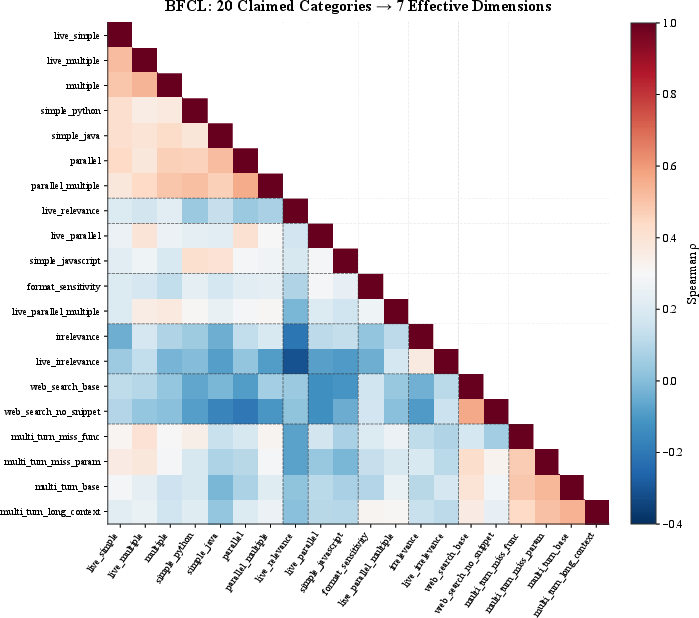
Figure 7: Redundancy in BFCL: 20 claimed function-call categories, but only seven structurally distinct clusters are present.
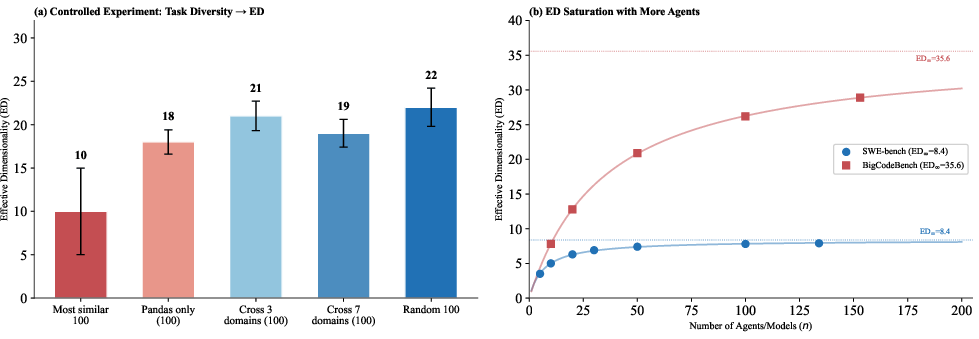
Figure 8: Controlled structural diversity, not topic diversity, drives ED; saturation curves for SWE-bench and BigCodeBench, showing required sample size for ED convergence.
Benchmark Compression and Aging
Performance-conditional and temporal analyses reveal a striking compression phenomenon: as model performance increases, effective dimensionality often declines, reflecting growing population homogeneity. The exception is observed among frontier models, where ED partially recovers, plausibly due to architectural and optimization diversity. Such declines are robust even after normalizing variance within score windows and have profound implications for ongoing benchmark maintenance and leaderboard interpretation.
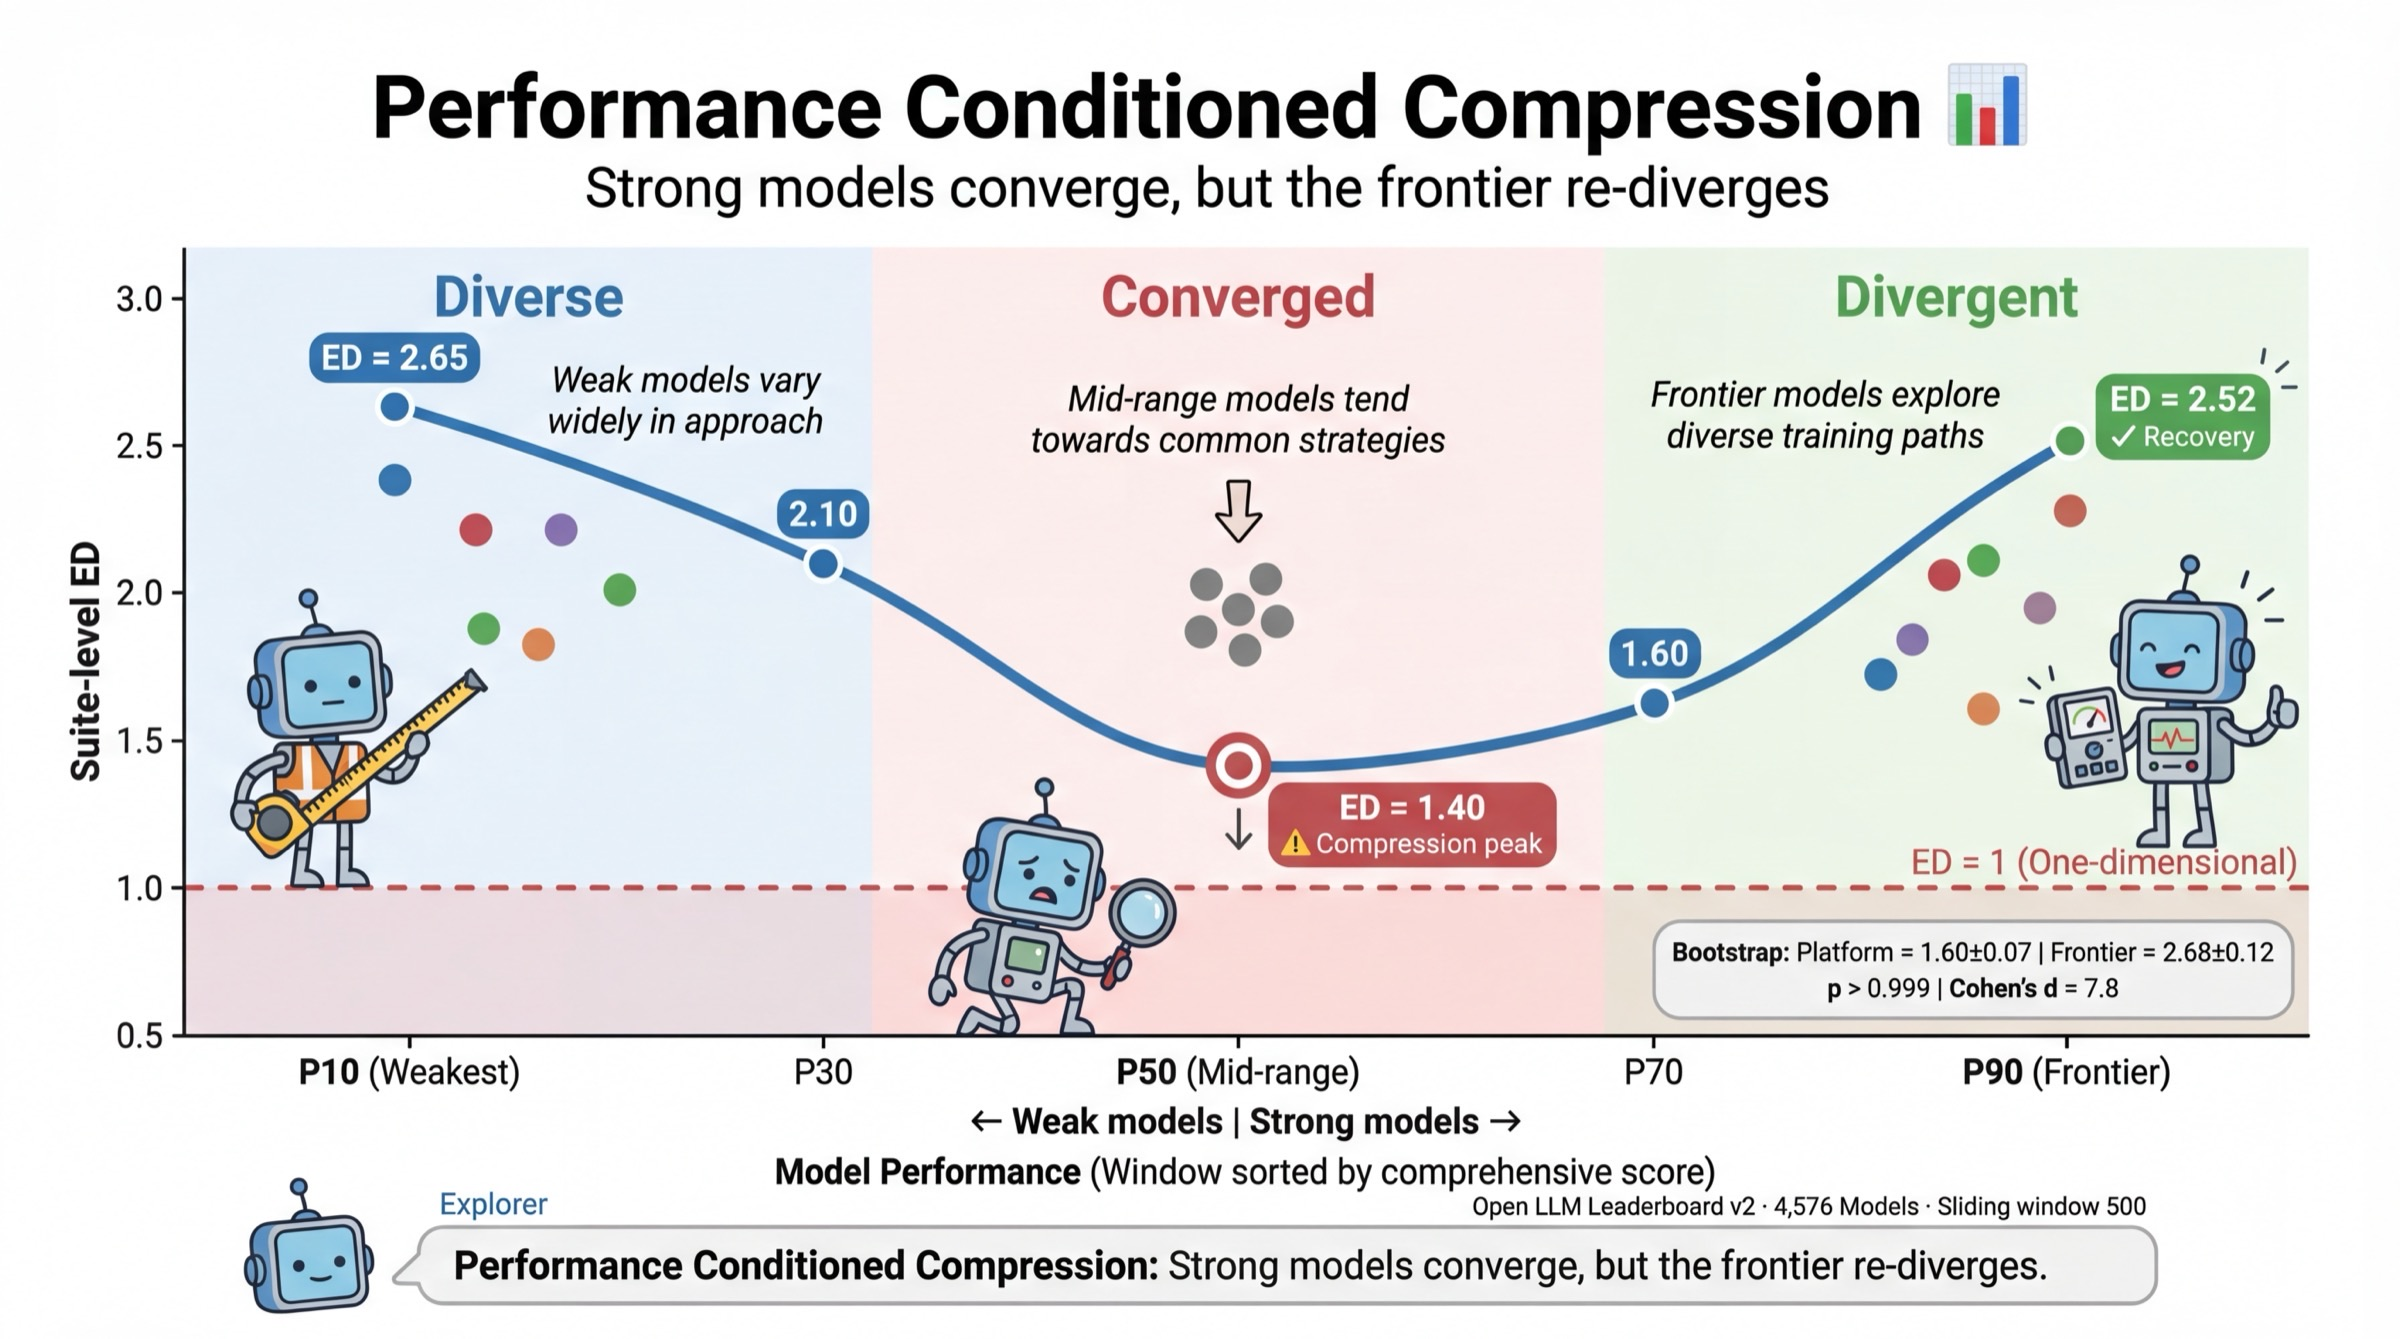
Figure 9: Performance-conditional ED compression curves on the Open LLM Leaderboard; as mean performance increases, redundancy rises and ED decreases, partly recovering at the top.
Benchmark “aging” is substantiated using time-series data from SWE-bench: as new generations of agents arrive, overall solve rates improve while pairwise agent differentiation shrinks, and ED declines, driven in part by ceiling effects but confirmed in fixed-variance subset analysis.
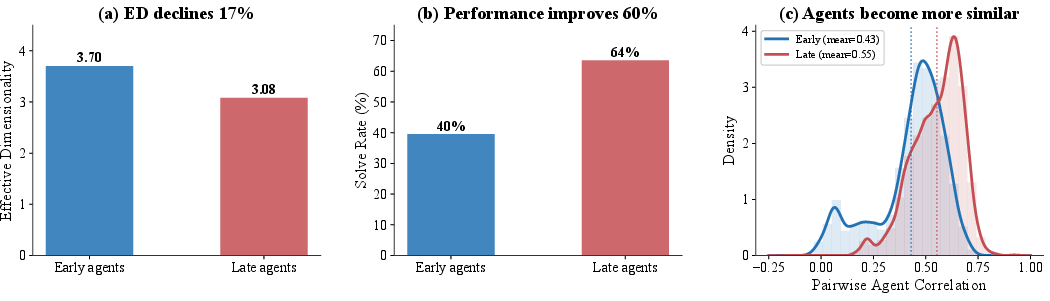
Figure 10: Temporal “aging” of SWE-bench: ED and agent differentiation decline as solve rates rise; late populations exhibit greater homogeneity even after controlling variance.
Semantic Validation of Principal Components
Population principal components extracted via SVD correspond to concrete, interpretable capability axes. For SWE-bench, PCs identify generational boundaries (pre/post-2025 agents), open vs. proprietary model status, and domain specificity. For BigCodeBench, PCs separate code-specialized from general-purpose models and instruction-tuned from base variants. However, component semantics are strictly population-conditional; only the top 1–2 PCs are reliably reproducible across population splits.
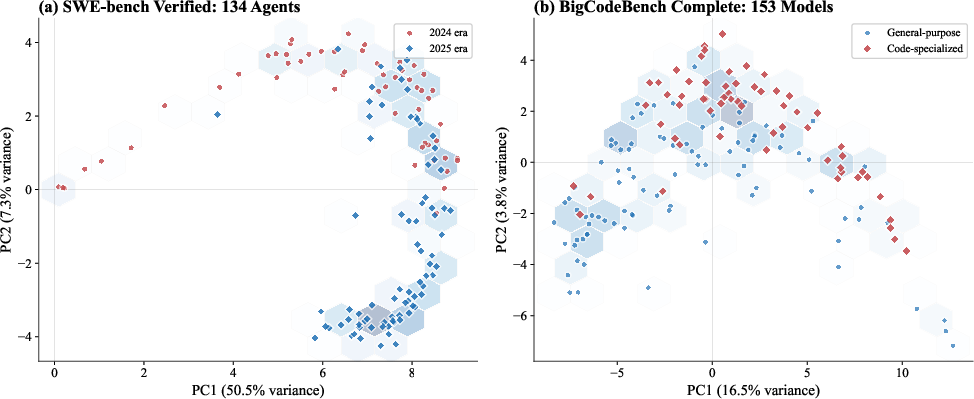
Figure 11: Semantic content of top principal components validated by external metadata—for SWE-bench, temporal agent stratification; for BigCodeBench, distinction between code-specialist and general-purpose models.
Diagnostic Workflow for Benchmark Maintainers
The authors propose a systematic, closed-form workflow for benchmark maintainers:
- Flag redundant pairs: Identify task pairs with ED=1.76; eliminate or merge redundancies.
- Suite-level ED: Screen the overall measurement breadth; if ED=1.77, the suite is effectively unidimensional.
- Temporal ED monitoring: Track ED longitudinally to detect benchmark "aging" as model populations evolve.
- Additions vetting: Only admit new tasks uncorrelated with existing suite (ED=1.78); high correlation indicates little new information.
Heuristics for interpreting ED are established: low ED can be desirable for focused evaluation (e.g., MATH), while high ED is mandatory for composite or broad-coverage benchmarking.
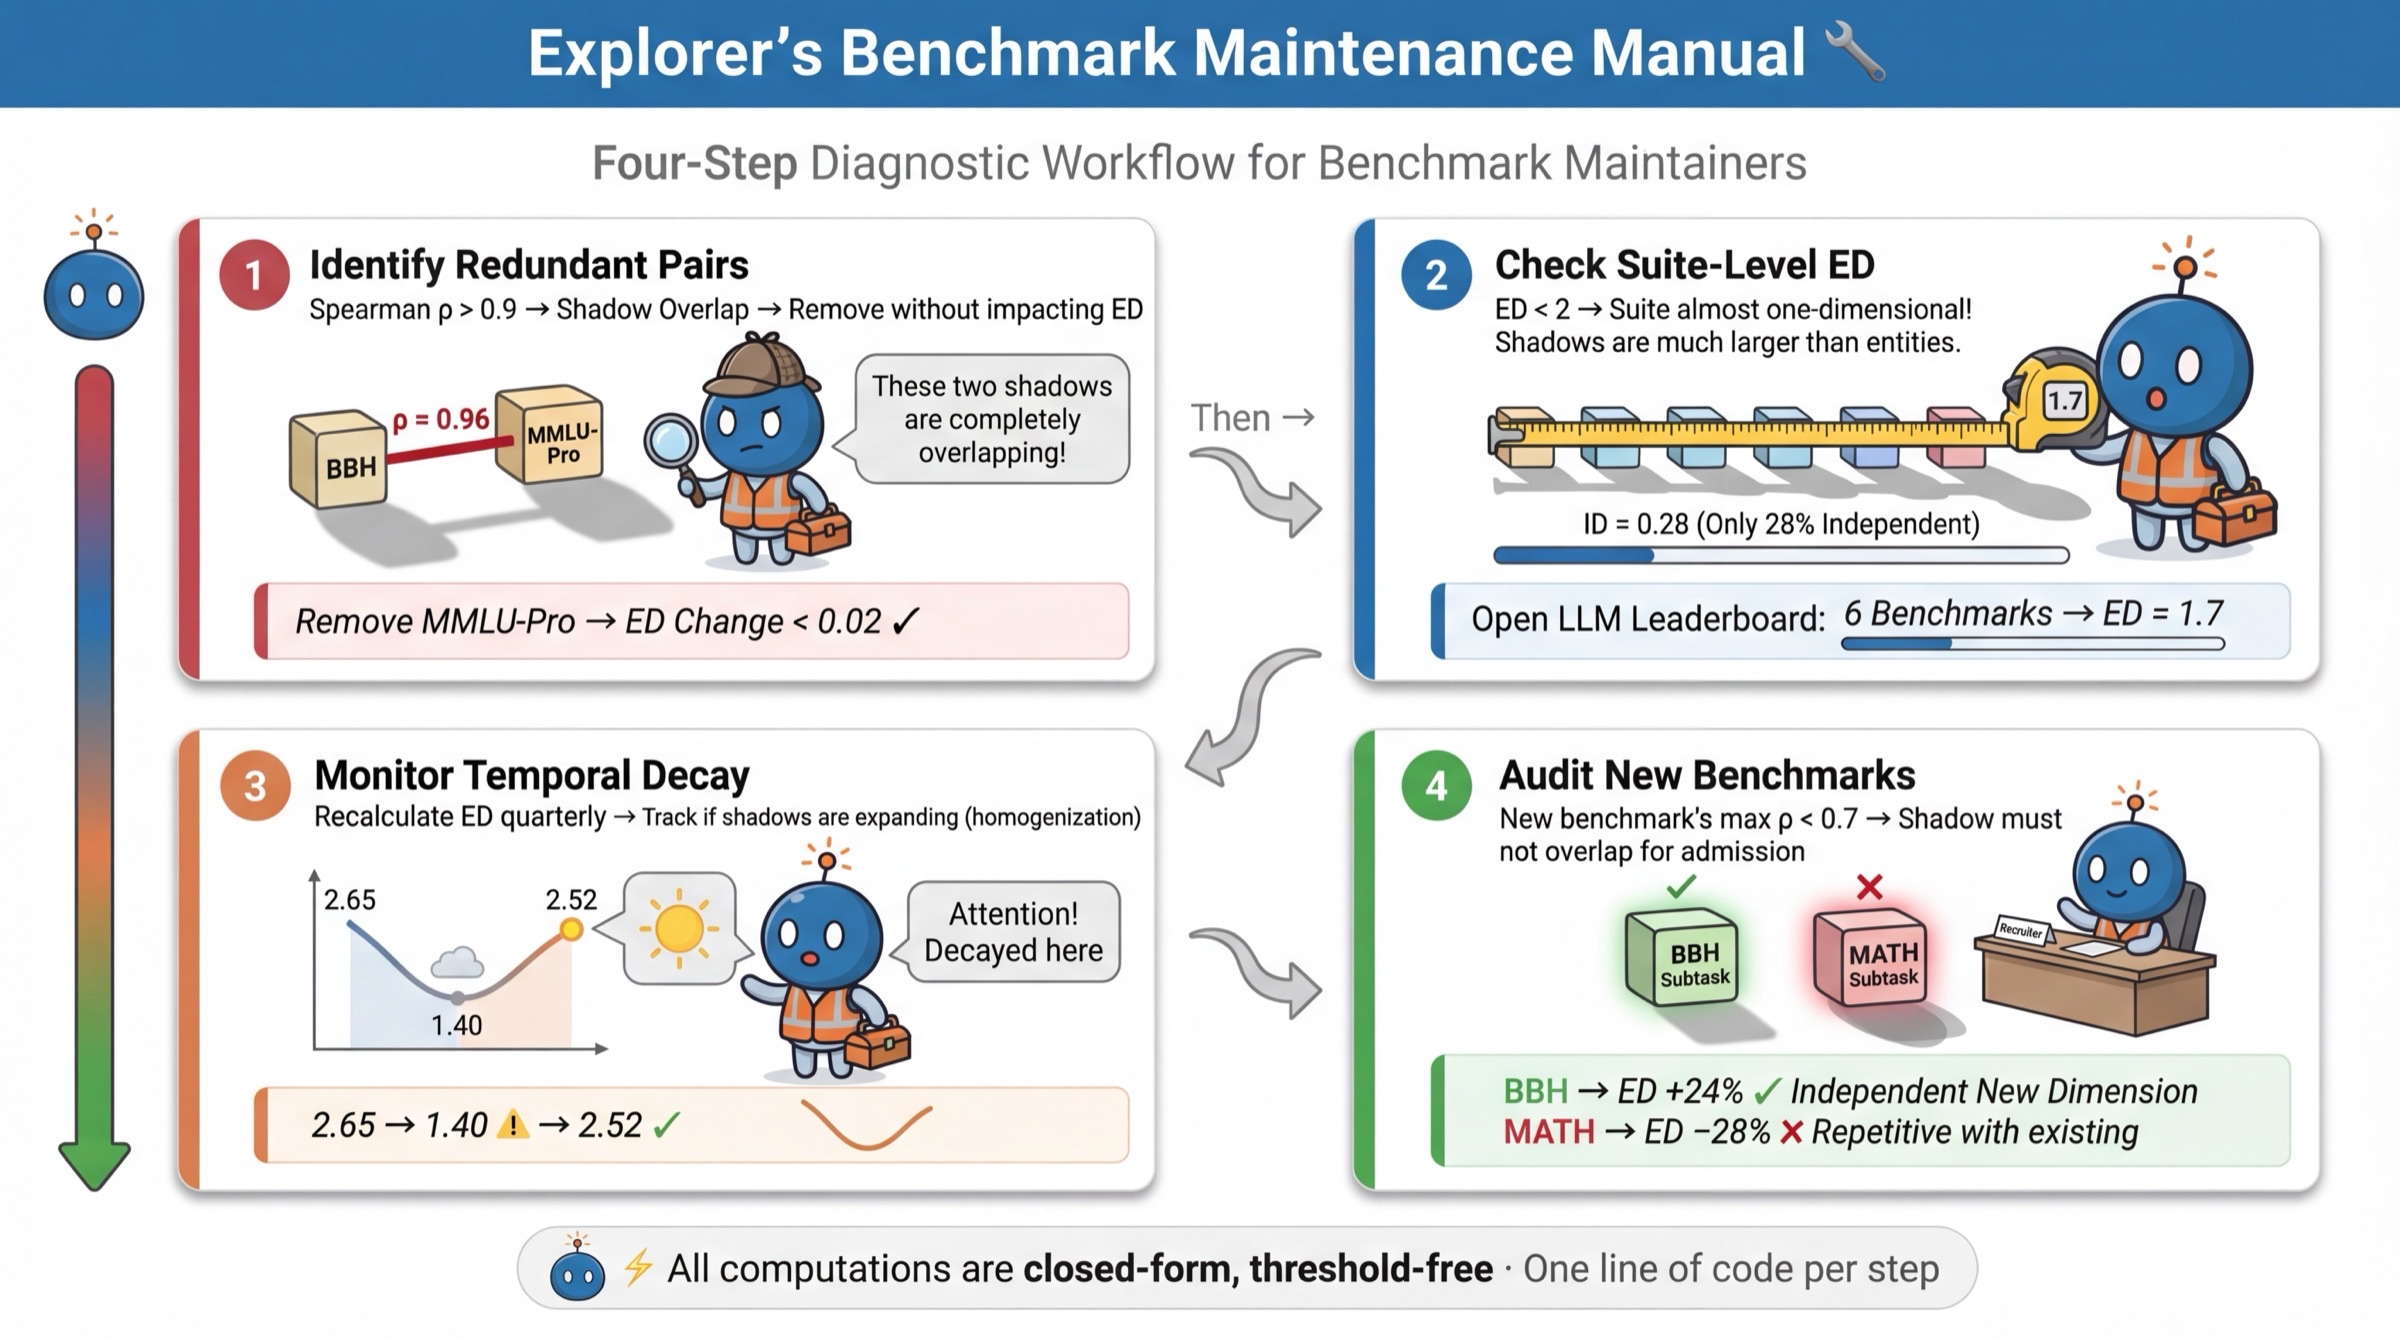
Figure 12: Proposed four-step workflow for maintainers to detect redundancy, check breadth, monitor suite health over time, and vet meaningful additions.
Algorithmic Task Selection: ED-Greedy
The ED-Greedy algorithm is introduced for selecting maximally diverse task subsets:
- Iteratively select the next task maximizing marginal ED gain.
- On BigCodeBench, ED-Greedy achieves ED=1.79 with σi0 tasks, compared to σi1 for random selection.
- Empirically, ED-Greedy generalizes well to unseen models, providing robust rankings without overfitting.
ED effectively predicts compression cost; high-ED benchmarks require substantially more tasks to preserve ranking fidelity.
Implications, Limitations, and Future Directions
Practical Implications:
- Composite benchmark scores often mislead, with redundancy inflating perceived model generality—benchmarks with high ED but structural overlap require reassessment.
- Negative conditional correlations indicate tradeoffs that cannot be ameliorated via composite scores.
- ED-based screening should become a standard diagnostic in competitive evaluation and benchmark maintenance.
Limitations:
- Absolute ED values are population-conditional; comparisons require matched dimension controls.
- Pearson-based ED can overestimate latent dimensionality on binary matrices; correction via tetrachoric estimators is recommended for tighter bounds.
- The diagnostic strongly depends on present (and possibly non-representative) model populations; structural dynamics should be tracked over time.
Future Work:
- Causal validation of conditional negative correlations via controlled training interventions.
- Real-time ED monitoring to automatically flag benchmark degredation.
- Theoretical development of ranking robustness with respect to ED and structural heterogeneity.
Conclusion
BenchScope delivers a robust, spectral-theoretic methodology for quantifying the independent measurement capacity of AI benchmarks. The central empirical finding is that most evaluation suites contain much less independent signal than their design suggests—scoring redundancy and composite ranking fragility are endemic. The authors’ four-step workflow grounded in ED, validated by extensive cross-ecosystem analysis, provides actionable guidance for designers, users, and maintainers. Adopting such methods is crucial for credible, interpretable, and scientifically sound model evaluation as the field transitions to ever-larger, more capable, but also more specialized AI systems.

