- The paper introduces SysOM-AI, enabling continuous, cross-layer performance diagnosis for production AI training with minimal overhead.
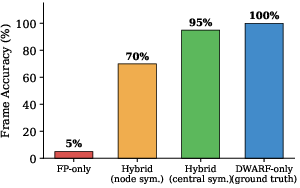
- It employs a hybrid stack unwinding and centralized symbol resolution approach to achieve over 95% frame accuracy across CPU, GPU, and network layers.
- Evaluation on 80,000+ GPUs reduced diagnosis times from days to 10 minutes, effectively detecting systemic performance regressions in distributed systems.
Motivation and Problem Statement
Production-scale AI training at enterprise datacenters now requires orchestration over thousands of GPUs, leading to heightened sensitivity to minor OS- or system-level inefficiencies that manifest as significant aggregate slowdowns. Existing profiling and observability tools remain compartmentalized: GPU profilers lack coverage at the OS and framework level and cause prohibitive runtime overhead, while CPU or application-level profilers miss crucial device and kernel-layer context. These limitations prevent continuous deployment and necessitate extensive, time-consuming manual analysis to root-cause performance regressions and straggler phenomena in large-scale distributed jobs.
The paper introduces SysOM-AI, a production-grade observability infrastructure deployed at Alibaba, specifically targeting this cross-layer diagnosis gap in distributed AI training. Through tightly integrated, always-on profiling across CPU, GPU, and network layers, SysOM-AI delivers both high coverage and negligible impact—addressing OS-level stalls, device-induced delays, and framework-specific inefficiencies in a unified analytic pipeline.
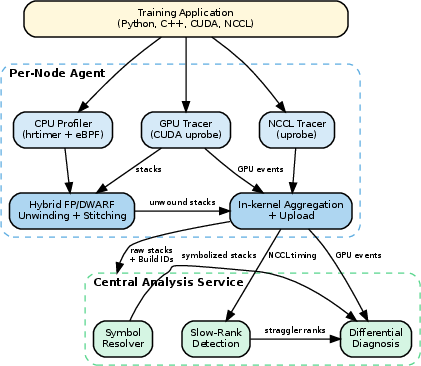
Figure 1: SysOM-AI system architecture integrates per-node agents for CPU stack and GPU/network event collection, centralized symbol resolution, slow-rank detection, and layered diagnosis.
System Architecture and Core Design
SysOM-AI is comprised of three primary subsystems: continuous eBPF-based data collection per node, centralized symbol resolution/aggregation, and an analytic differential diagnosis pipeline. The collection mechanism orchestrates periodic sampling of CPU stacks (including full kernel stacks), GPU kernel event capture through CUDA uprobes, and pervasive NCCL collective events via eBPF uprobes.
This architecture is underpinned by three key technical advances:
Layered Differential Diagnosis Methodology
SysOM-AI formalizes layered differential diagnosis in distributed AI jobs. The pipeline applies statistical anomaly detection within communication groups—calculating per-function CPU utilization waterlines, detecting slow or straggler ranks using synchronized collective event data, and leveraging GPU/CPU/OS-level cross-rank diffing to isolate the responsible subsystem.
When temporal (job-wide) uniform slowdowns are observed without cross-rank heterogeneity, per-job historical flame graph baselines enable sensitive detection of emergent hot code paths. These analyses are agnostic to framework, application binary, and kernel version, since all data is mapped in a standardized, build-ID-indexed space.
End-to-End Production Evaluation
SysOM-AI has operated continuously across 80,000+ GPUs and 10,000+ nodes, ingesting ∼400 TiB daily. During a six-month window, 2,649 diagnostic events were flagged and classified, with median diagnosis times for cross-layer issues reduced from days to approximately 10 minutes.
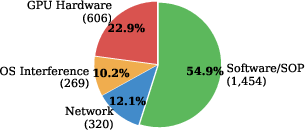
Figure 3: Distribution of diagnostic event root causes during six months in production (GPU, OS, network, software).
Case Analysis
1. GPU Thermal Throttling: Straggler detection and GPU flame graph diffing revealed uniform kernel slowdowns in a single node, indicating a global hardware frequency reduction. Standard device utilization tools reported saturation, masking the issue; only cross-rank differential diagnosis surfaced the underlying thermal condition.

Figure 4: Straggler NCCL event timing exposes delayed rank entry, triggering cross-layer analysis.
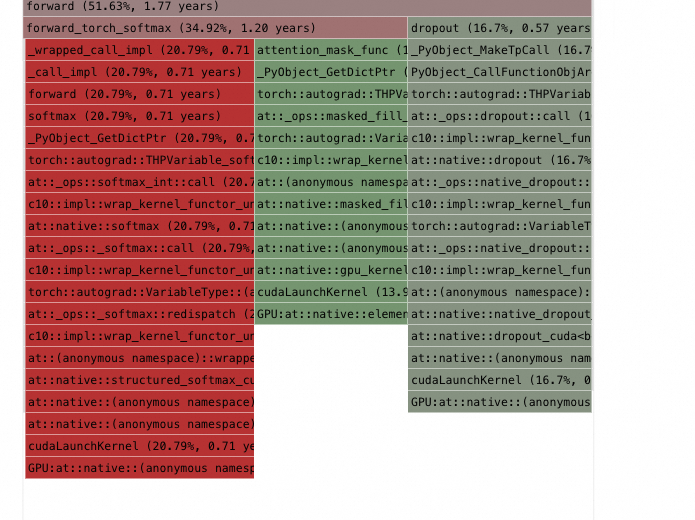
Figure 5: Differential GPU flame graph validation attributes delay to system-wide GPU throttling, not operator-specific inefficiency.
2. NIC Soft-Interrupt Contention: Differential CPU analysis exposed heavy net_rx_action and interrupt handler activity on a straggler rank, missed by previous profilers due to incomplete kernel stack unwinding.
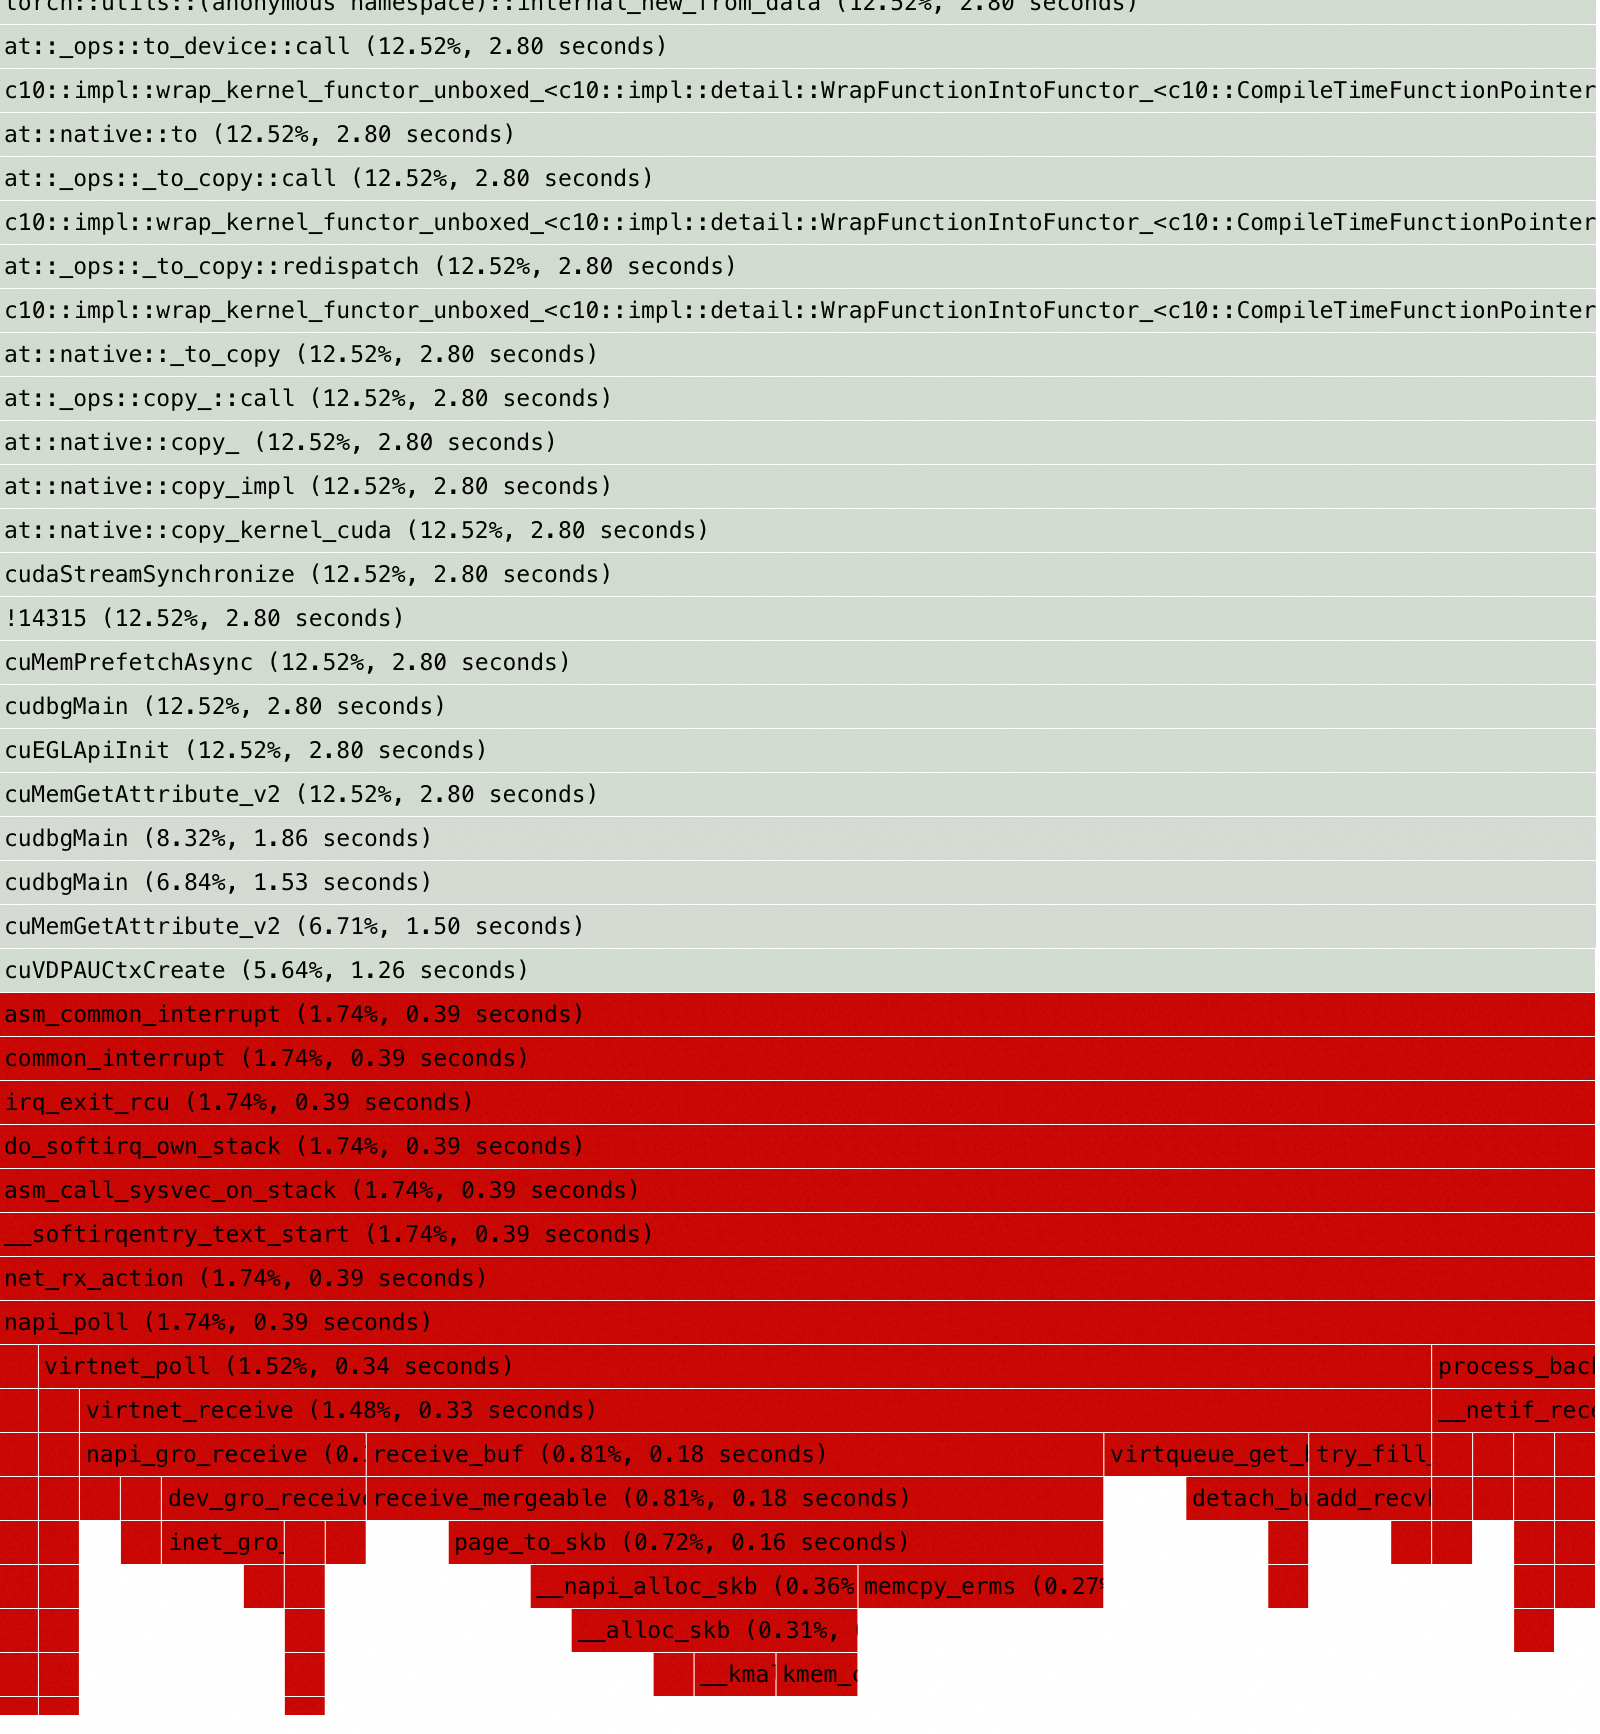
Figure 6: Kernel-stack-resolved CPU flame graph identifies a distinctive softirq handling chain on only the straggler node, enabling root cause isolation.
3. VFS Dentry Lock Contention: Kernel-space profiler visibility detected all application threads blocked in queued spinlock slowpaths within VFS path lookup, immediately traced to co-tenant daemon-reloads—this diagnosis requires persistent OS kernel visibility absent in all prior AI profiling tools.

Figure 7: Systemic kernel lock contention captured in kernel flame graphs, impossible for userland profilers to recover.
4. Excessive Userspace Logging: Temporal flame graph baselines surfaced a new hot path after an infrastructure update, despite no per-rank outliers, leading to the identification of increased logging verbosity and per-iteration serialization overhead.
5. Data Ingestion Bottleneck: The combination of uniform NCCL timing and increased user-space time in parallel file system routines pinpointed end-to-end throughput collapse on the data pipeline, not infrastructure or training loop code.
Overhead and Quantitative Outcomes
SysOM-AI's steady-state profiling overhead is below 0.4% at production sampling rates (10 samples/s), and even at maximal configuration never exceeds 1.72%. The hybrid unwinder achieves a 95%+ frame accuracy rate. Centralized symbolization eliminates the 50%+ misattribution observed in node-side symbol-resolved stacks.
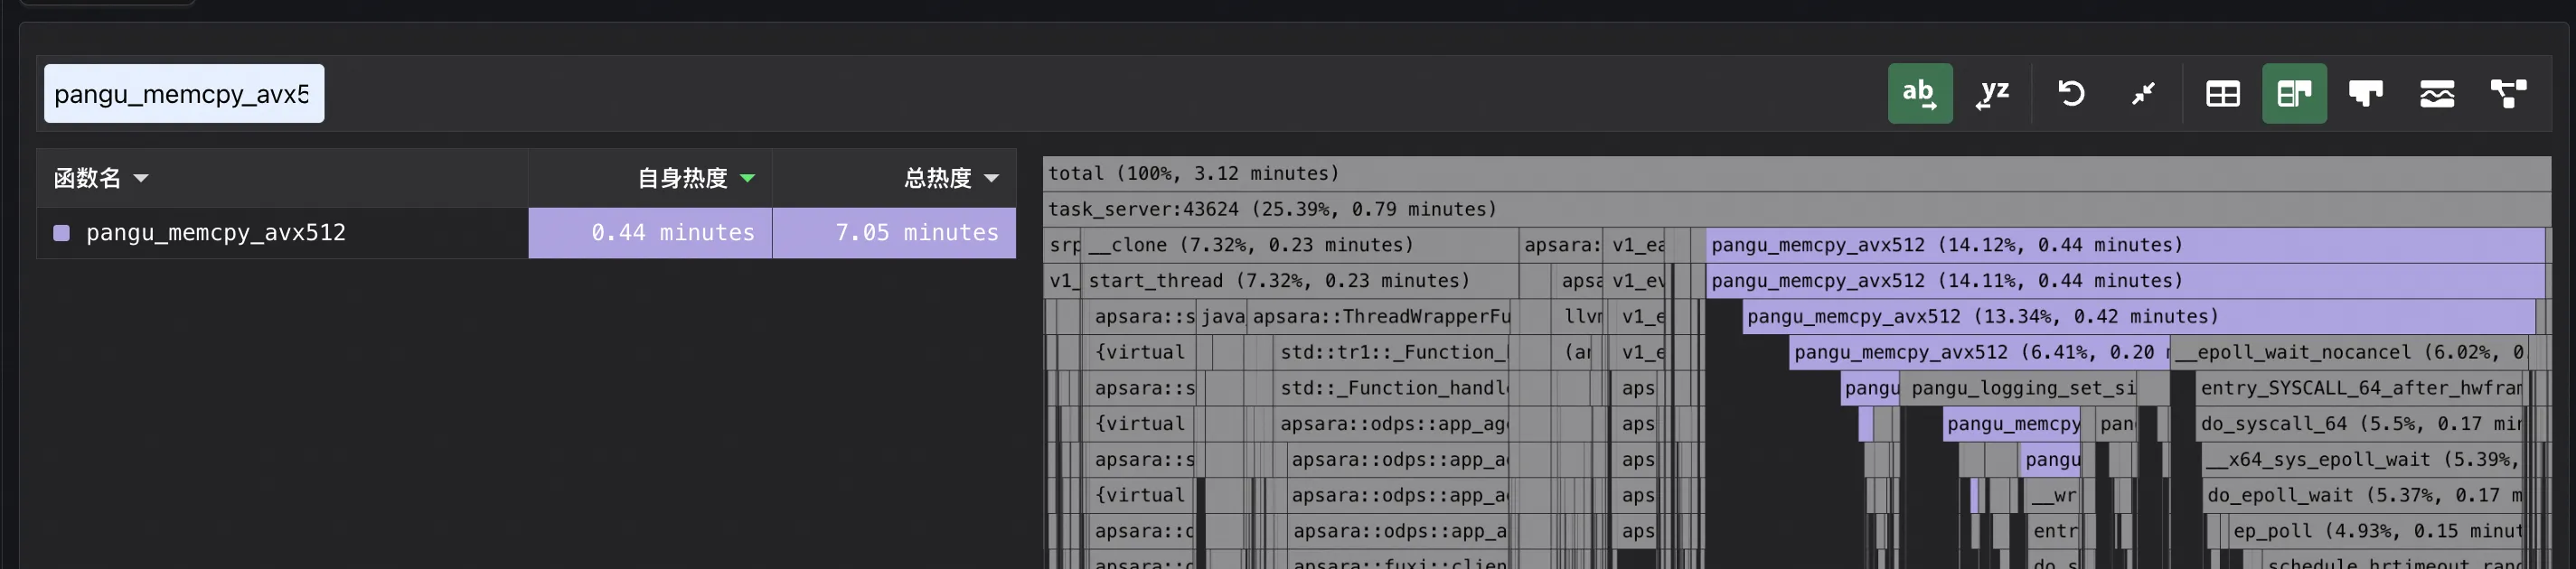
Figure 8: Per-node symbol misattribution can create large fictitious hotspots, eliminated by centralized build-ID-indexed symbolization.
Implications and Future Outlook
SysOM-AI substantiates that continuous, cross-layer, fully automated observability is technically feasible at production scale without compromising application throughput or code transparency. This demonstrates the operational viability of deploying high-accuracy kernel+userspace profiling as a fleet-wide service—a design pattern that will necessarily extend to other domains (HPC, cloud serving, etc.) where performance pathologies span OS, device, and distributed layers.
Limitations persist regarding off-CPU blocking, full GPU call stack introspection, and rare cases where outlier detection is confounded by uniform (majority) slowdowns. However, the hybrid unwinding, symbol resolution, and analytic stratification pipeline represent distinct advances likely to be adopted in future distributed and heterogeneous systems observability tools.
Conclusion
SysOM-AI delivers an integrated, always-on, cross-layer profiling and diagnosis capability tailored for large-scale, distributed AI training. By achieving high stack accuracy, minimal runtime overhead, and tight analytic coupling of CPU, GPU, and OS events, it fundamentally reduces operational burden and accelerates large-scale incident response. This architecture sets a technical standard for future continuous profiling systems at hyperscale and demonstrates how production observability is best delivered via cross-layer, centrally coordinated analytics that are both framework-agnostic and device-diverse.
(2603.29235)