- The paper introduces BrainRing, a zero-installation, interactive web tool that visualizes brain connectivity using chord diagrams in real time.
- The paper details a D3.js v7 implementation with a three-panel design supporting multiple neuroimaging atlases and flexible, immediate visual customizations.
- The paper demonstrates how BrainRing dramatically reduces figure generation time from hours to seconds, facilitating publication-ready outputs.
Introduction
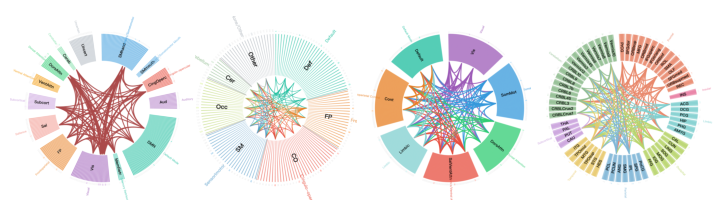
Brain connectivity visualization demands reproducibility, flexibility, and accessibility to accommodate the needs of modern neuroimaging research. Chord diagrams have become the de facto standard for summarizing pairwise functional connectivity (FC) between brain regions, offering a compact, information-rich visual representation of both gross and fine-grained cortico-cortical organization. Traditional methods such as Circos and BrainNet Viewer impose substantial setup overhead, technical barriers, or software licensing constraints, limiting the efficiency of figure generation and tuning. "BrainRing: An Interactive Web-Based Tool for Brain Connectivity Chord Diagram Visualization" (2603.27162) directly addresses these limitations through a distributable, installation-free HTML application supporting real-time, high-resolution connectivity visualization with robust support for multiple brain atlases and flexible visual customization.
System Architecture and User Interface
BrainRing is implemented as a self-contained single-file HTML application leveraging D3.js v7 for all SVG rendering. With a file size of approximately 185 KB, it operates entirely client-side, without external dependencies or server communication. This design ensures true zero-installation deployment across workstations, laptops, and tablets regardless of operating system.
The interface employs a three-panel layout to streamline the end-to-end visualization pipeline: data import and configuration (left), the live-updating chord diagram (center), and appearance customization (right). All configuration changes, including atlas selection, edge filtering, color schemes, and font size adjustments, are applied immediately without any compile or “run” steps. A bilingual toggle facilitates seamless switching between Chinese and English, reflecting a commitment to internationalization and inclusivity.
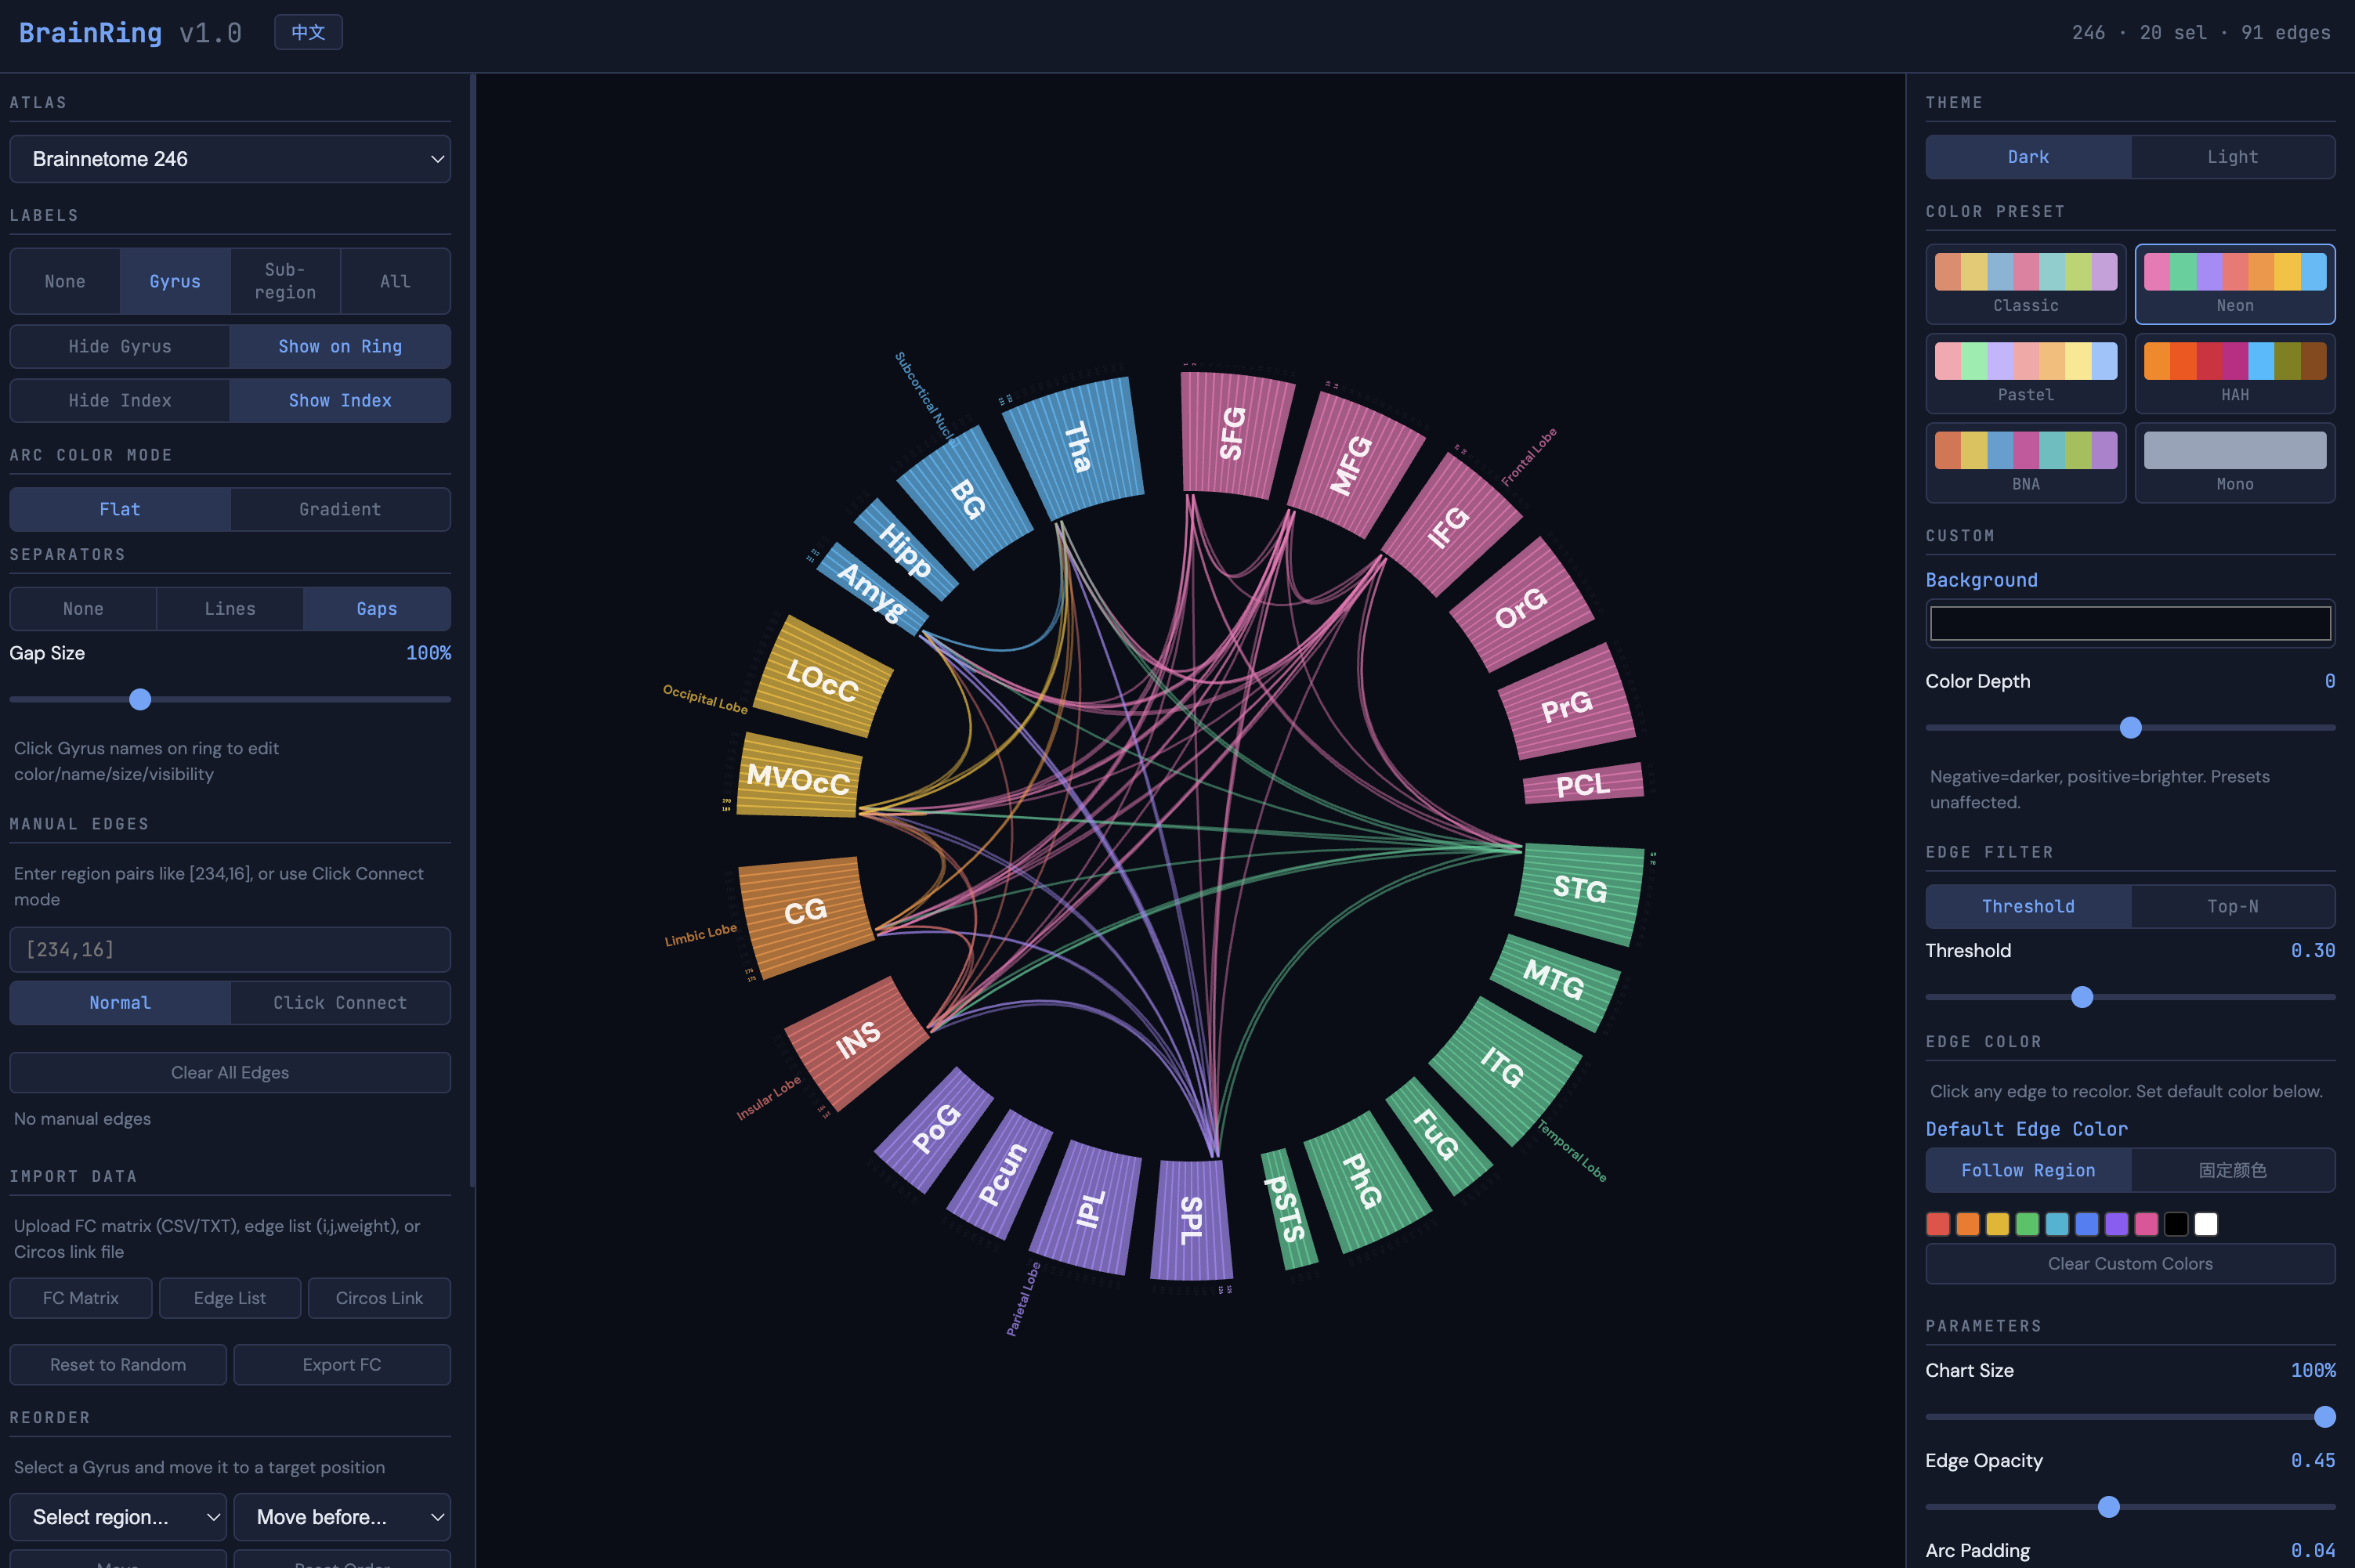
Figure 1: The BrainRing interface comprises configuration, visualization, and styling panels, incorporating extensive parameter controls and real-time preview for interactive FC diagram creation.
Data Integration and Atlas Support
A distinguishing feature of BrainRing is its tight integration with eight prevalent anatomical and functional brain atlases: Brainnetome 246, AAL-90/116, Schaefer 100/200/400, Power 264, and Dosenbach 160. Each built-in atlas is hierarchically parsed to support lobe, gyrus, and subregion-level annotation, and users can interactively browse and select regions at any granularity.
The tool is equipped to accept FC matrices (as symmetric CSV, TXT, or TSV files), sparse edge list formats (i, j, weight), or standard Circos link files (complete with per-edge color encoding). Manual edge creation is supported through both input fields and an interactive “click-to-connect” mode, enhancing usability for bespoke or exploratory figures. All manually added connections are displayed in an editable list with full regional labels and individual deletion controls. Region order can be flexibly edited at the gyrus level, with all relevant connectivity mappings remapped internally to preserve data consistency.
Visual Customization and Styling
BrainRing offers advanced parameterization of chord diagrams suitable for publication-quality output:
Compared to Circos and BrainNet Viewer, BrainRing uniquely fulfills the following requirements:
- Fully browser-based without installation or licensing
- Real-time manipulation of all visual parameters
- Pre-integration with a broad suite of neuroimaging atlas templates
- Support for color-annotated Circos files and ad hoc edge creation
- Bilingual interface for non-English researchers
- Export-ready figures requiring no post-processing
These affordances eliminate the need for programming expertise or iterative scripting, fundamentally reducing the time from FC data to publication-quality figures from hours to seconds.
Broader Impact and Future Directions
Although BrainRing is tailored to brain FC visualization, the underlying principles, data ingestion pipeline, and rendering logic are directly extensible to other scientific domains where chord diagrams are salient—such as genomics, ecological networks, and microbiome studies. The interface paradigms and flexible template support lower the barrier for adoption among researchers with limited programming proficiency.
The authors propose expanding template definitions and hierarchies to accommodate domains beyond brain connectivity, as well as opening the codebase for community-driven augmentation.
Conclusion
BrainRing uniquely synthesizes a zero-installation, bilingual, real-time FC chord diagram visualization workflow within a single HTML file architecture. Through multi-atlas support, comprehensive data import options, interactive visual parameterization, and instant publication-quality export, the tool substantially reduces technical friction and democratizes high-quality connectivity visualization for the neuroimaging community and beyond.